Copyright
©The Author(s) 2015.
World J Gastroenterol. Apr 21, 2015; 21(15): 4509-4516
Published online Apr 21, 2015. doi: 10.3748/wjg.v21.i15.4509
Published online Apr 21, 2015. doi: 10.3748/wjg.v21.i15.4509
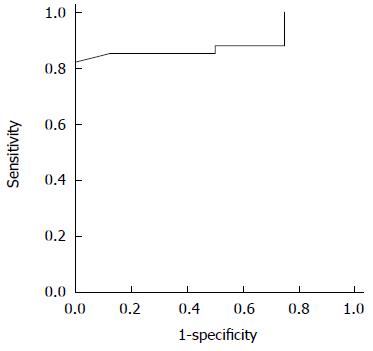
Figure 7 Receiver operating characteristic curve showing that the prediction of elevated portal pressure (free portal pressure ≥ 18 cmH2O) based on the intensity of the portal venous phase/hepatic arterial phase was 0.
895.
- Citation: Zhai L, Qiu LY, Zu Y, Yan Y, Ren XZ, Zhao JF, Liu YJ, Liu JB, Qian LX. Contrast-enhanced ultrasound for quantitative assessment of portal pressure in canine liver fibrosis. World J Gastroenterol 2015; 21(15): 4509-4516
- URL: https://www.wjgnet.com/1007-9327/full/v21/i15/4509.htm
- DOI: https://dx.doi.org/10.3748/wjg.v21.i15.4509


