Copyright
©The Author(s) 2015.
World J Gastroenterol. Apr 21, 2015; 21(15): 4509-4516
Published online Apr 21, 2015. doi: 10.3748/wjg.v21.i15.4509
Published online Apr 21, 2015. doi: 10.3748/wjg.v21.i15.4509
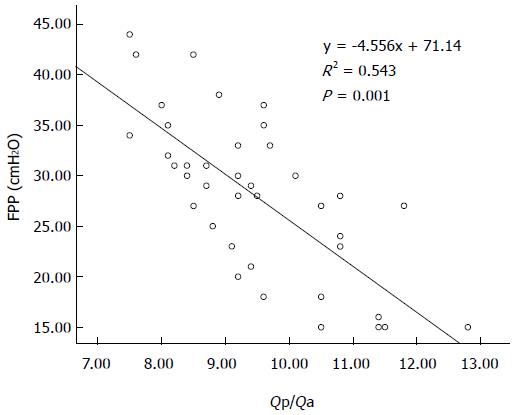
Figure 4 Relationship between the area under the curve of the portal venous phase/hepatic arterial phase (Qp/Qa) and free portal pressure in the canine model.
Free portal pressure measurements from model animals at all time points were plotted as a function of Qp/Qa in order to assess the relationship between the two parameters.
- Citation: Zhai L, Qiu LY, Zu Y, Yan Y, Ren XZ, Zhao JF, Liu YJ, Liu JB, Qian LX. Contrast-enhanced ultrasound for quantitative assessment of portal pressure in canine liver fibrosis. World J Gastroenterol 2015; 21(15): 4509-4516
- URL: https://www.wjgnet.com/1007-9327/full/v21/i15/4509.htm
- DOI: https://dx.doi.org/10.3748/wjg.v21.i15.4509


