Copyright
©The Author(s) 2015.
World J Gastroenterol. Apr 21, 2015; 21(15): 4509-4516
Published online Apr 21, 2015. doi: 10.3748/wjg.v21.i15.4509
Published online Apr 21, 2015. doi: 10.3748/wjg.v21.i15.4509
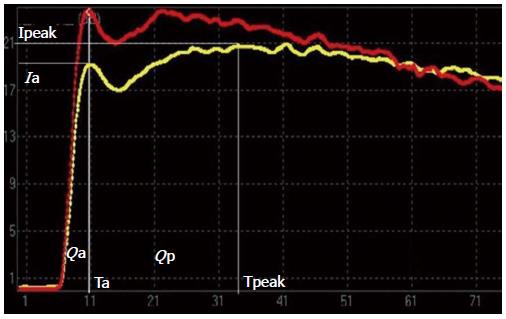
Figure 3 Time-intensity curves of the hepatic parenchyma and the renal cortex in the liver-kidney section of the canine model at 24 wk.
The red and yellow lines represent the time-intensity curves (TICs) of the hepatic parenchyma and the renal cortex, respectively, in a treated animal. Points on the curve are highlighted where the data for the parameters indicated were derived. “Ta” represents the time at which renal intensity reaches the peak of the TIC. “Ia” represents the intensity at the time of Ta in the TIC of the hepatic parenchyma. Ipeak and Tpeak represent the maximum intensity of the TIC of the hepatic parenchyma and the time at which the TIC arrives at Ipeak, respectively. The area under the curve of portal venous time and the hepatic arterial time are expressed as Qp and Qa, respectively. The proportion of hepatic arterial infusion increased, and Qp/Qa and Ip/Ia were reduced.
- Citation: Zhai L, Qiu LY, Zu Y, Yan Y, Ren XZ, Zhao JF, Liu YJ, Liu JB, Qian LX. Contrast-enhanced ultrasound for quantitative assessment of portal pressure in canine liver fibrosis. World J Gastroenterol 2015; 21(15): 4509-4516
- URL: https://www.wjgnet.com/1007-9327/full/v21/i15/4509.htm
- DOI: https://dx.doi.org/10.3748/wjg.v21.i15.4509


