Copyright
©The Author(s) 2015.
World J Gastroenterol. Apr 7, 2015; 21(13): 3970-3977
Published online Apr 7, 2015. doi: 10.3748/wjg.v21.i13.3970
Published online Apr 7, 2015. doi: 10.3748/wjg.v21.i13.3970
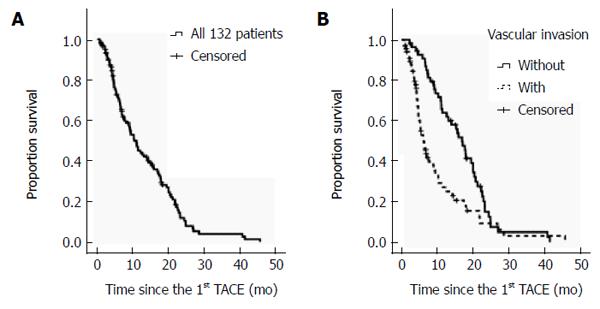
Figure 1 Overall survival curves.
A: The Kaplan-Meier overall survival curve for all 132 patients in this study; B: The factor that significantly influenced survival was revealed by multivariate analysis. P value stratified log-rank test; Hazard ratio was obtained with the Cox model; TACE: Transarterial chemoembolization.
- Citation: Li JH, Xie XY, Zhang L, Le F, Ge NL, Li LX, Gan YH, Chen Y, Zhang JB, Xue TC, Chen RX, Xia JL, Zhang BH, Ye SL, Wang YH, Ren ZG. Oxaliplatin and 5-fluorouracil hepatic infusion with lipiodolized chemoembolization in large hepatocellular carcinoma. World J Gastroenterol 2015; 21(13): 3970-3977
- URL: https://www.wjgnet.com/1007-9327/full/v21/i13/3970.htm
- DOI: https://dx.doi.org/10.3748/wjg.v21.i13.3970


