Copyright
©The Author(s) 2015.
World J Gastroenterol. Apr 7, 2015; 21(13): 3893-3903
Published online Apr 7, 2015. doi: 10.3748/wjg.v21.i13.3893
Published online Apr 7, 2015. doi: 10.3748/wjg.v21.i13.3893
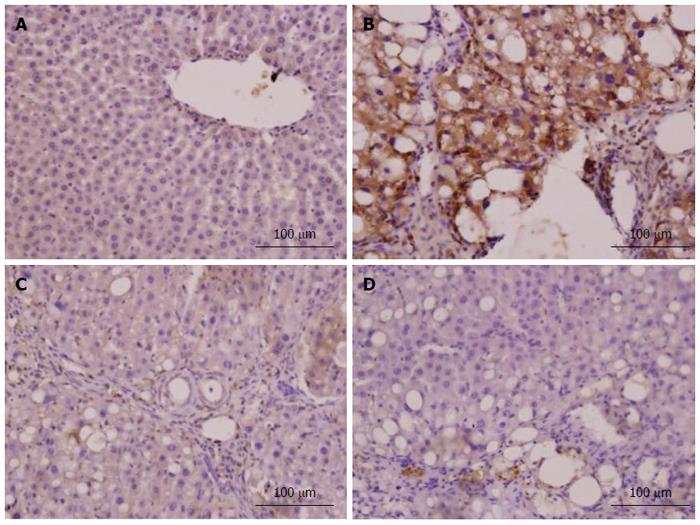
Figure 8 α-smooth muscle actin expression in liver tissue (immunohistochemistry, × 400).
The α-smooth muscle actin (α-SMA) expression level in liver tissue was confirmed by immunohistochemistry (× 400). A: Liver sections of the normal group showed a small amount of α-SMA-positive cells only present in vascular wall; B: Liver sections of the model group showed that the α-SMA protein was predominantly present in the fibrous septa, inflamed area and portal area; C: Liver sections of the vitamin E group showed that α-SMA-positive cells were distributed in fibroplasia and inflamed area, but the number of positive cells was less than that in the model group; D: Liver sections of the CAPE (12 mg/kg) group showed that α-SMA-positive cells were sparse, located in inflamed area. The results of the other groups are not shown here.
- Citation: Li M, Wang XF, Shi JJ, Li YP, Yang N, Zhai S, Dang SS. Caffeic acid phenethyl ester inhibits liver fibrosis in rats. World J Gastroenterol 2015; 21(13): 3893-3903
- URL: https://www.wjgnet.com/1007-9327/full/v21/i13/3893.htm
- DOI: https://dx.doi.org/10.3748/wjg.v21.i13.3893


