Copyright
©The Author(s) 2015.
World J Gastroenterol. Apr 7, 2015; 21(13): 3893-3903
Published online Apr 7, 2015. doi: 10.3748/wjg.v21.i13.3893
Published online Apr 7, 2015. doi: 10.3748/wjg.v21.i13.3893
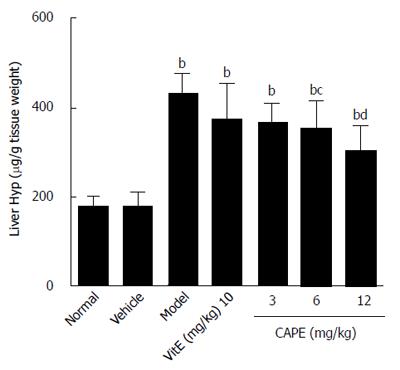
Figure 2 Liver hydroxyproline contents in the groups.
Bars and error bars represent mean ± SD. t = 4.959-10.38, bP < 0.01 vs normal group; t = 3.090-5.148, cP < 0.05, dP < 0.01 vs model group, respectively. CAPE: Caffeic acid phenethyl ester; Vit E: Vitamin E; Hyp: Hydroxyproline.
- Citation: Li M, Wang XF, Shi JJ, Li YP, Yang N, Zhai S, Dang SS. Caffeic acid phenethyl ester inhibits liver fibrosis in rats. World J Gastroenterol 2015; 21(13): 3893-3903
- URL: https://www.wjgnet.com/1007-9327/full/v21/i13/3893.htm
- DOI: https://dx.doi.org/10.3748/wjg.v21.i13.3893


