Copyright
©The Author(s) 2015.
World J Gastroenterol. Mar 28, 2015; 21(12): 3537-3546
Published online Mar 28, 2015. doi: 10.3748/wjg.v21.i12.3537
Published online Mar 28, 2015. doi: 10.3748/wjg.v21.i12.3537
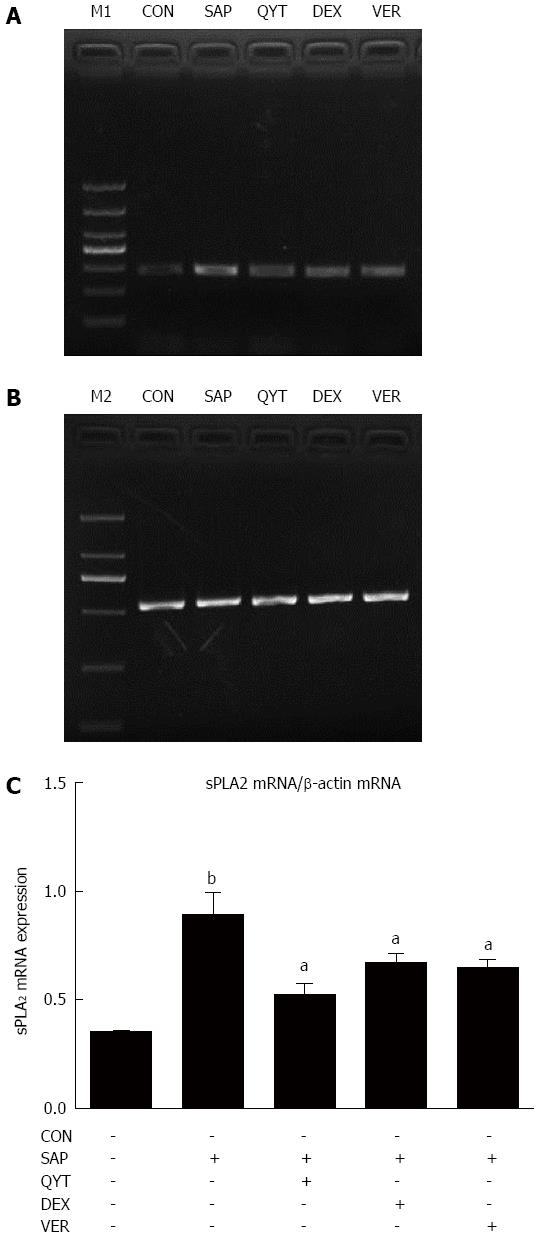
Figure 3 Electrophoresis micrographs of secreted phospholipase A2 and β-actin mRNA quantitative PCR products.
Electrophoresis micrograph of A: sPLA2 mRNA (283 bp); and B: β-actin (as internal control; 531 bp); C: Gray value ratio of sPLA2 to β-actin mRNA expression. aP < 0.05 vs SAP; bP < 0.01 vs CON. CON: Control; DEX: Dexamethasone; M1: 1000 bp-marker; M2: 2000 bp-marker; QYT: Qingyi decoction; SAP: Severe acute pancreatitis; VER: Verapamil.
- Citation: Zhang JW, Zhang GX, Chen HL, Liu GL, Owusu L, Wang YX, Wang GY, Xu CM. Therapeutic effect of Qingyi decoction in severe acute pancreatitis-induced intestinal barrier injury. World J Gastroenterol 2015; 21(12): 3537-3546
- URL: https://www.wjgnet.com/1007-9327/full/v21/i12/3537.htm
- DOI: https://dx.doi.org/10.3748/wjg.v21.i12.3537


