Copyright
©The Author(s) 2015.
World J Gastroenterol. Mar 28, 2015; 21(12): 3480-3491
Published online Mar 28, 2015. doi: 10.3748/wjg.v21.i12.3480
Published online Mar 28, 2015. doi: 10.3748/wjg.v21.i12.3480
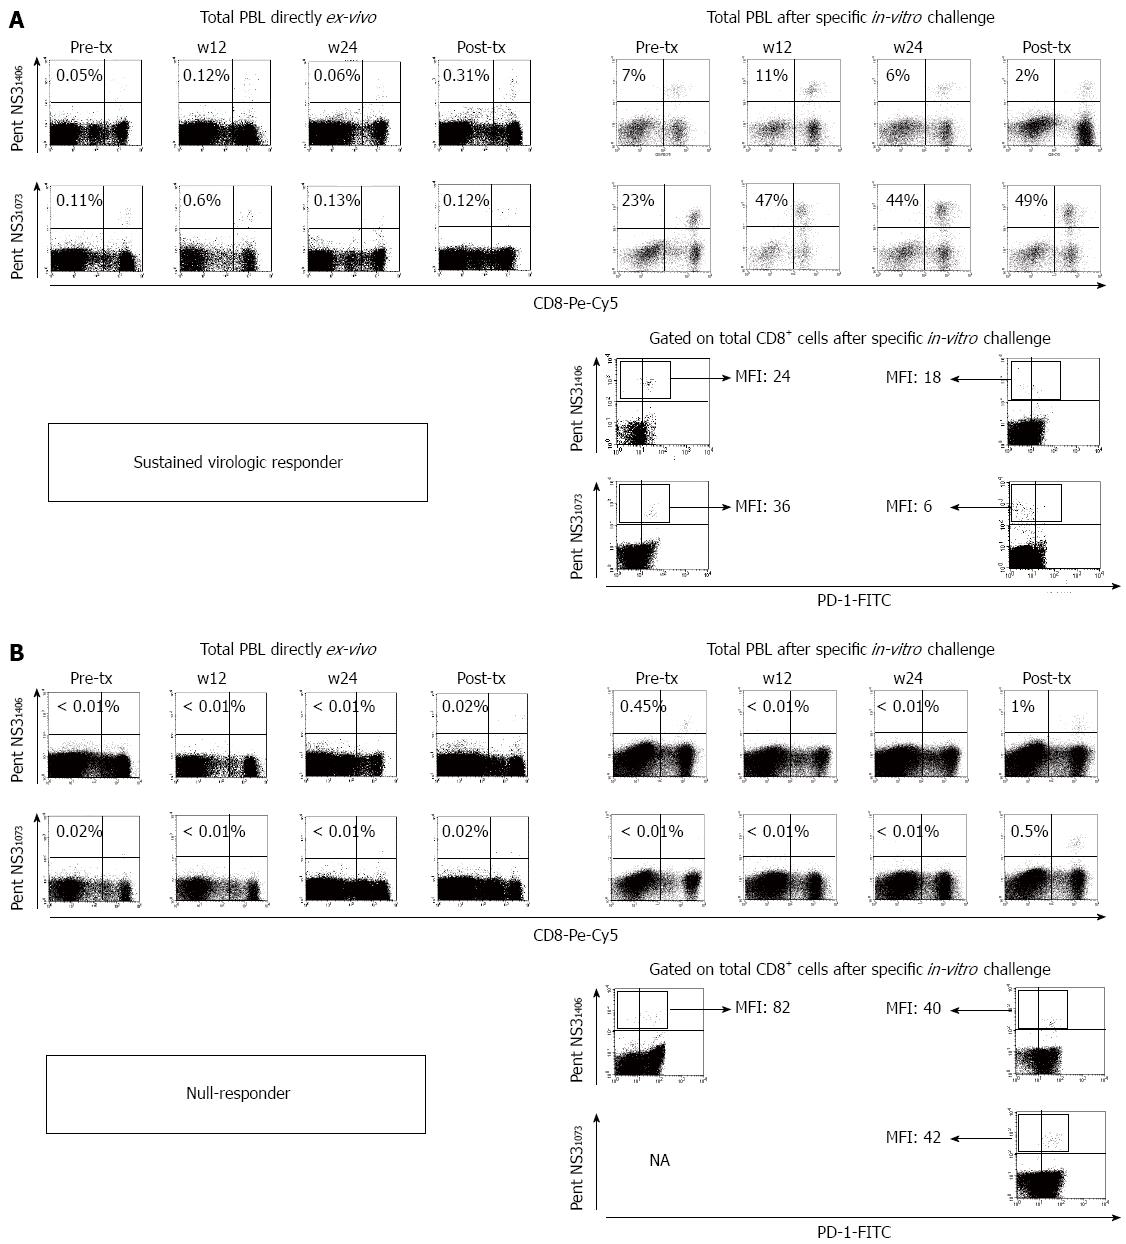
Figure 3 Representative FACS® dot-plots of peripheral blood mononuclear cells from a sustained viral responder (A) and a null responder (B) after treatment with pegylated-α2-interferon plus ribavirin.
The dot-plots show the frequency of hepatitis C virus (HCV)-specific cytotoxic T lymphocyte (CTLs) directly ex-vivo and after specific in-vitro challenge, besides the PD-1 phenotype pre- and after treatment. PBL: Peripheral blood lymphocytes; MFI: Mean fluorescence intensity; tx: Treatment; NA: Not available; PentNS31406: Multimeric complexes HLA-A2/NS31406 phycoerithryn labelled; PentNS31073: Multimeric complexes HLA-A2/NS31073 phycoerithryn labelled.
- Citation: Larrubia JR, Moreno-Cubero E, Miquel J, Sanz-de-Villalobos E. Hepatitis C virus-specific cytotoxic T cell response restoration after treatment-induced hepatitis C virus control. World J Gastroenterol 2015; 21(12): 3480-3491
- URL: https://www.wjgnet.com/1007-9327/full/v21/i12/3480.htm
- DOI: https://dx.doi.org/10.3748/wjg.v21.i12.3480


