Copyright
©The Author(s) 2015.
World J Gastroenterol. Jan 7, 2015; 21(1): 155-163
Published online Jan 7, 2015. doi: 10.3748/wjg.v21.i1.155
Published online Jan 7, 2015. doi: 10.3748/wjg.v21.i1.155
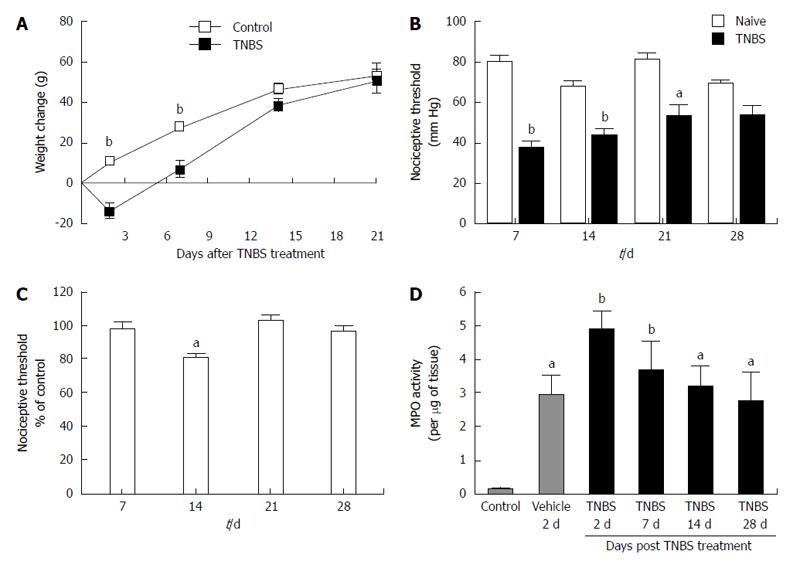
Figure 1 Colitis induction following trinitrobenzene sulfonic acid administration.
A: Weight loss after trinitrobenzene sulfonic acid (TNBS) enema. Graph shows the weight change in grams after TNBS treatment (n = 20 for control, n = 20 for Day 0, n = 20 for Day 2, n = 20 for Day 7, n = 12 for Day 14, n = 5 for Day 21); B: Visceral hypersensitivity after TNBS treatment. Graph representing colo-rectal distension (CRD) scores in mmHg before and after TNBS (n = 10 for 7 d, n = 15 for 14 d, n = 5 for 21 d, n = 8 for 28 d); C: somatic hypersensitivity after TNBS treatment. Graph representing the mechanical threshold testing on the hind paws, Von Frey. Data were shown as a percentage of control (naïve) threshold response (n = 21 for 7 d, n = 24 for 14 d, n = 12 for 21 d, n = 27 for 28 d); D: presence of inflammation following TNBS-induced colitis. Graph shows the average myeloperoxidase (MPO) activity (vehicle = ethanol, for all conditions, n = 3, each with 8 replicates). aP < 0.05, bP < 0.01 vs controls; ANOVA with Bonferroni’s and Dunnett’s posttests.
- Citation: Del Valle-Pinero AY, Sherwin LB, Anderson EM, Caudle RM, Henderson WA. Altered vasoactive intestinal peptides expression in irritable bowel syndrome patients and rats with trinitrobenzene sulfonic acid-induced colitis. World J Gastroenterol 2015; 21(1): 155-163
- URL: https://www.wjgnet.com/1007-9327/full/v21/i1/155.htm
- DOI: https://dx.doi.org/10.3748/wjg.v21.i1.155


