Copyright
©2014 Baishideng Publishing Group Co.
World J Gastroenterol. Mar 7, 2014; 20(9): 2420-2425
Published online Mar 7, 2014. doi: 10.3748/wjg.v20.i9.2420
Published online Mar 7, 2014. doi: 10.3748/wjg.v20.i9.2420
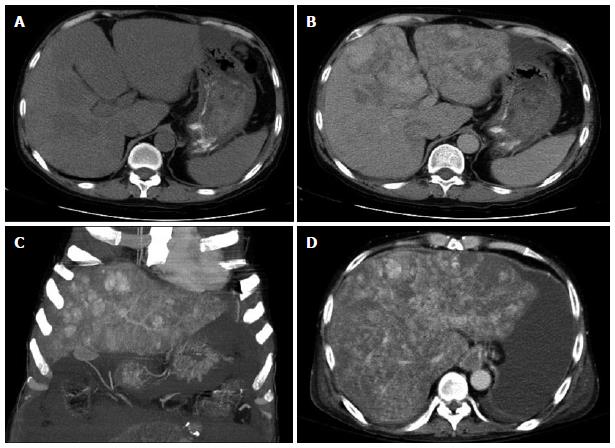
Figure 2 Liver dynamic computed tomography showing multiple liver tumors.
A: Hypodense liver tumors before contrast injection; B: Heterogeneous enhancement in the arterial phase and portal venous phase after contrast injection; C: Follow-up computed tomography showing increased size of the hepatic lesion; D: Massive ascites observed at 4 mo after the follow-up.
- Citation: Yu CY, Chang LC, Chen LW, Lee TS, Chien RN, Hsieh MF, Chiang KC. Peliosis hepatis complicated by portal hypertension following renal transplantation. World J Gastroenterol 2014; 20(9): 2420-2425
- URL: https://www.wjgnet.com/1007-9327/full/v20/i9/2420.htm
- DOI: https://dx.doi.org/10.3748/wjg.v20.i9.2420


