Copyright
©2014 Baishideng Publishing Group Co.
World J Gastroenterol. Feb 21, 2014; 20(7): 1858-1870
Published online Feb 21, 2014. doi: 10.3748/wjg.v20.i7.1858
Published online Feb 21, 2014. doi: 10.3748/wjg.v20.i7.1858
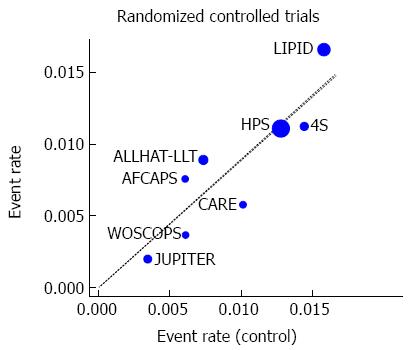
Figure 4 L’Abbé plot of the incidence of colorectal cancer in the experimental (statin) group, against the incidence in the control group, across the analyzed randomized controlled trials (n = 8).
- Citation: Lytras T, Nikolopoulos G, Bonovas S. Statins and the risk of colorectal cancer: An updated systematic review and meta-analysis of 40 studies. World J Gastroenterol 2014; 20(7): 1858-1870
- URL: https://www.wjgnet.com/1007-9327/full/v20/i7/1858.htm
- DOI: https://dx.doi.org/10.3748/wjg.v20.i7.1858


