Copyright
©2014 Baishideng Publishing Group Co.
World J Gastroenterol. Feb 7, 2014; 20(5): 1289-1297
Published online Feb 7, 2014. doi: 10.3748/wjg.v20.i5.1289
Published online Feb 7, 2014. doi: 10.3748/wjg.v20.i5.1289
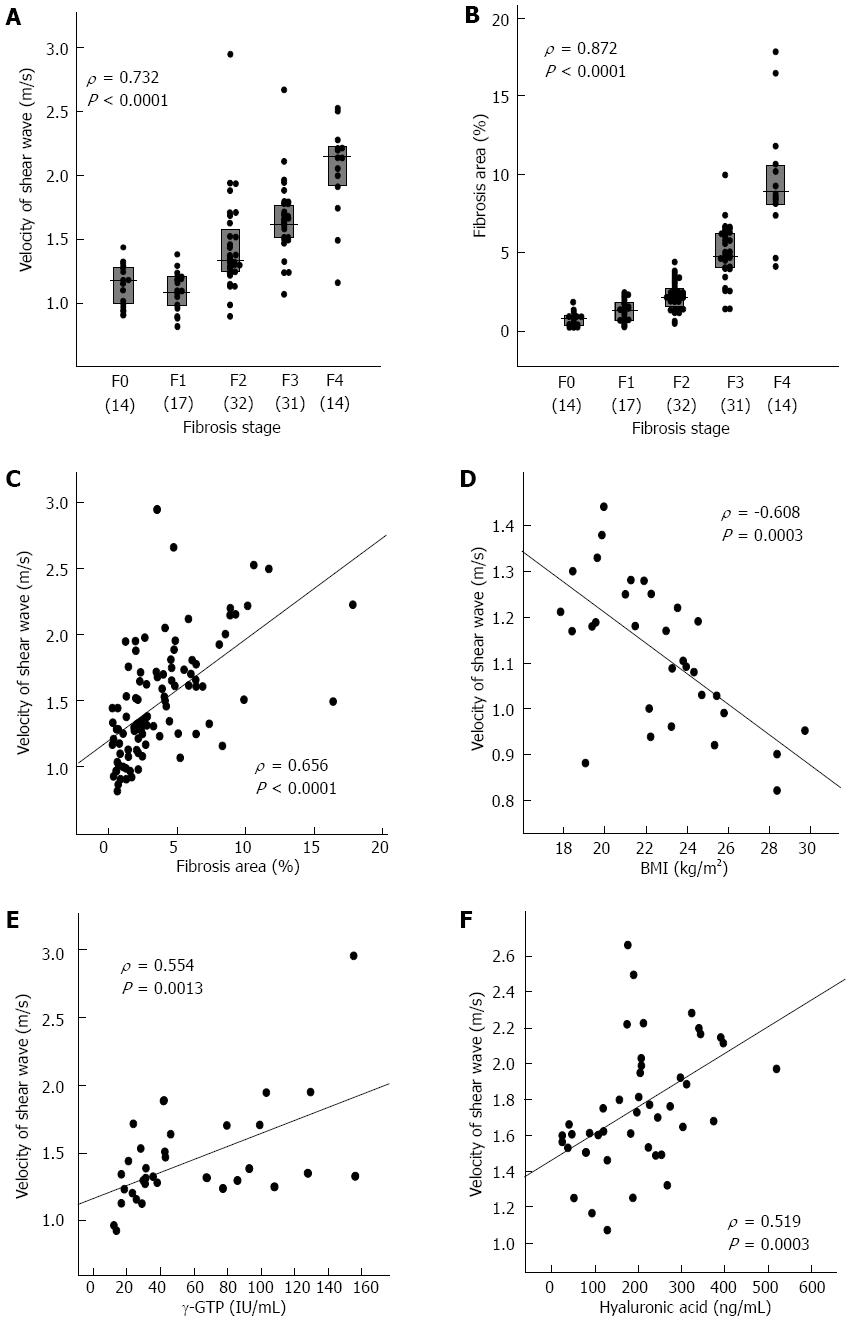
Figure 1 Correlation.
A: Between acoustic radiation force impulse (ARFI) and fibrosis stages. The velocity of the sheer wave measured by ARFI was significantly correlated with fibrosis stage in all 108 patients as assessed by the Metavir system (ρ = 0.732, P < 0.0001). Vertical lines and boxes indicate median values and interquartile ranges, respectively; B: Between proportion of fibrosis area and fibrosis stage. The proportion of fibrosis area was significantly correlated with fibrosis stage in all 108 patients as assessed by the Metavir system (ρ = 0.872, P < 0.0001). Vertical lines and boxes indicate median values and interquartile ranges, respectively; C: Between ARFI and proportion of fibrosis area. The velocity of the sheer wave measured by ARFI significantly correlated with the proportion of fibrosis area in all 108 patients (ρ = 0.656, P < 0.0001); D: Between ARFI and body mass index (BMI). The velocity of the sheer wave measured by ARFI significantly negatively correlated with BMI in patients with stage F0 or F1 (ρ = −0.608, P = 0.0003); E: Between ARFI and γ-glutamyltranspeptidase (γ-GTP) levels. The velocity of the sheer wave measured by ARFI significantly correlated with γ-GTP levels in patients with stage F2 (ρ = 0.544, P = 0.0013); F: Between ARFI and hyaluronic acid levels. The velocity of the sheer wave as measured by ARFI significantly correlated with hyaluronic acid levels in patients with stage F3 or F4 (ρ = 0.519, P = 0.0003).
- Citation: Nishikawa T, Hashimoto S, Kawabe N, Harata M, Nitta Y, Murao M, Nakano T, Mizuno Y, Shimazaki H, Kan T, Nakaoka K, Takagawa Y, Ohki M, Ichino N, Osakabe K, Yoshioka K. Factors correlating with acoustic radiation force impulse elastography in chronic hepatitis C. World J Gastroenterol 2014; 20(5): 1289-1297
- URL: https://www.wjgnet.com/1007-9327/full/v20/i5/1289.htm
- DOI: https://dx.doi.org/10.3748/wjg.v20.i5.1289


