
















©2014 Baishideng Publishing Group Inc.
World J Gastroenterol. Dec 28, 2014; 20(48): 18397-18403
Published online Dec 28, 2014. doi: 10.3748/wjg.v20.i48.18397
Published online Dec 28, 2014. doi: 10.3748/wjg.v20.i48.18397
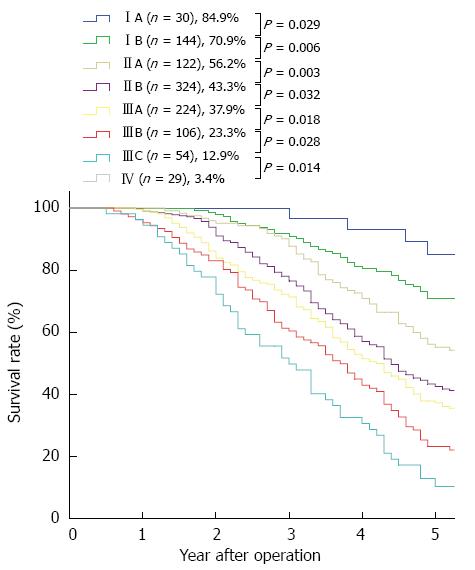
Figure 3 Survival curves for patient subgroups stratified according to the 7th edition TNM pStage groupings.
The 5-year survival rate, the number of patients in each subgroup, and the P-value for comparison between each adjacent subgroup are indicated. The survival curves showed stepwise reduction as the pStage increased, and there were significant differences between each adjacent pStage group.
- Citation: Wang J, Wu N, Zheng QF, Yan S, Lv C, Li SL, Yang Y. Evaluation of the 7th edition of the TNM classification in patients with resected esophageal squamous cell carcinoma. World J Gastroenterol 2014; 20(48): 18397-18403
- URL: https://www.wjgnet.com/1007-9327/full/v20/i48/18397.htm
- DOI: https://dx.doi.org/10.3748/wjg.v20.i48.18397