Copyright
©2014 Baishideng Publishing Group Inc.
World J Gastroenterol. Dec 28, 2014; 20(48): 18390-18396
Published online Dec 28, 2014. doi: 10.3748/wjg.v20.i48.18390
Published online Dec 28, 2014. doi: 10.3748/wjg.v20.i48.18390
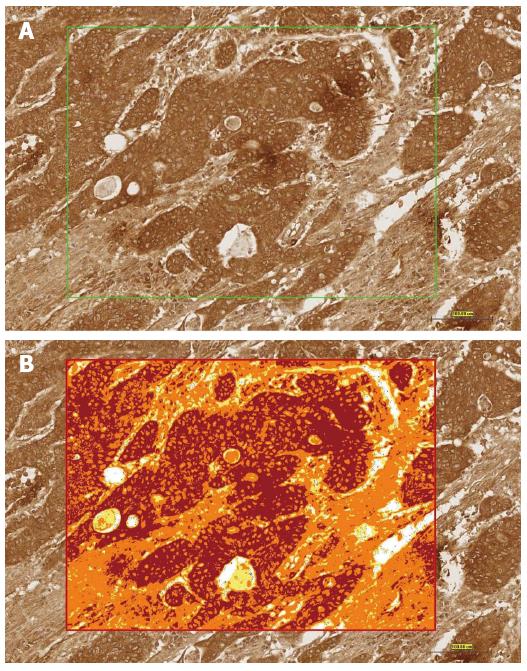
Figure 1 Image analysis of immunohistochemistry.
Representative images showing how image analysis was performed on cores immunostained for tumor necrosis factor-α. A: A square field is selected; B: A color markup overlay produced by the color deconvolution algorithm reflecting the intensity ranges of the Diaminobenzedine (brown) stain; blue, negative; yellow, weak positive; orange, medium positive; red, strong positive. Scale bar = 100 mm.
- Citation: Obeed OAA, Alkhayal KA, Sheikh AA, Zubaidi AM, Vaali-Mohammed MA, Boushey R, Mckerrow JH, Abdulla MH. Increased expression of tumor necrosis factor-α is associated with advanced colorectal cancer stages. World J Gastroenterol 2014; 20(48): 18390-18396
- URL: https://www.wjgnet.com/1007-9327/full/v20/i48/18390.htm
- DOI: https://dx.doi.org/10.3748/wjg.v20.i48.18390


