Copyright
©2014 Baishideng Publishing Group Inc.
World J Gastroenterol. Dec 28, 2014; 20(48): 18316-18329
Published online Dec 28, 2014. doi: 10.3748/wjg.v20.i48.18316
Published online Dec 28, 2014. doi: 10.3748/wjg.v20.i48.18316
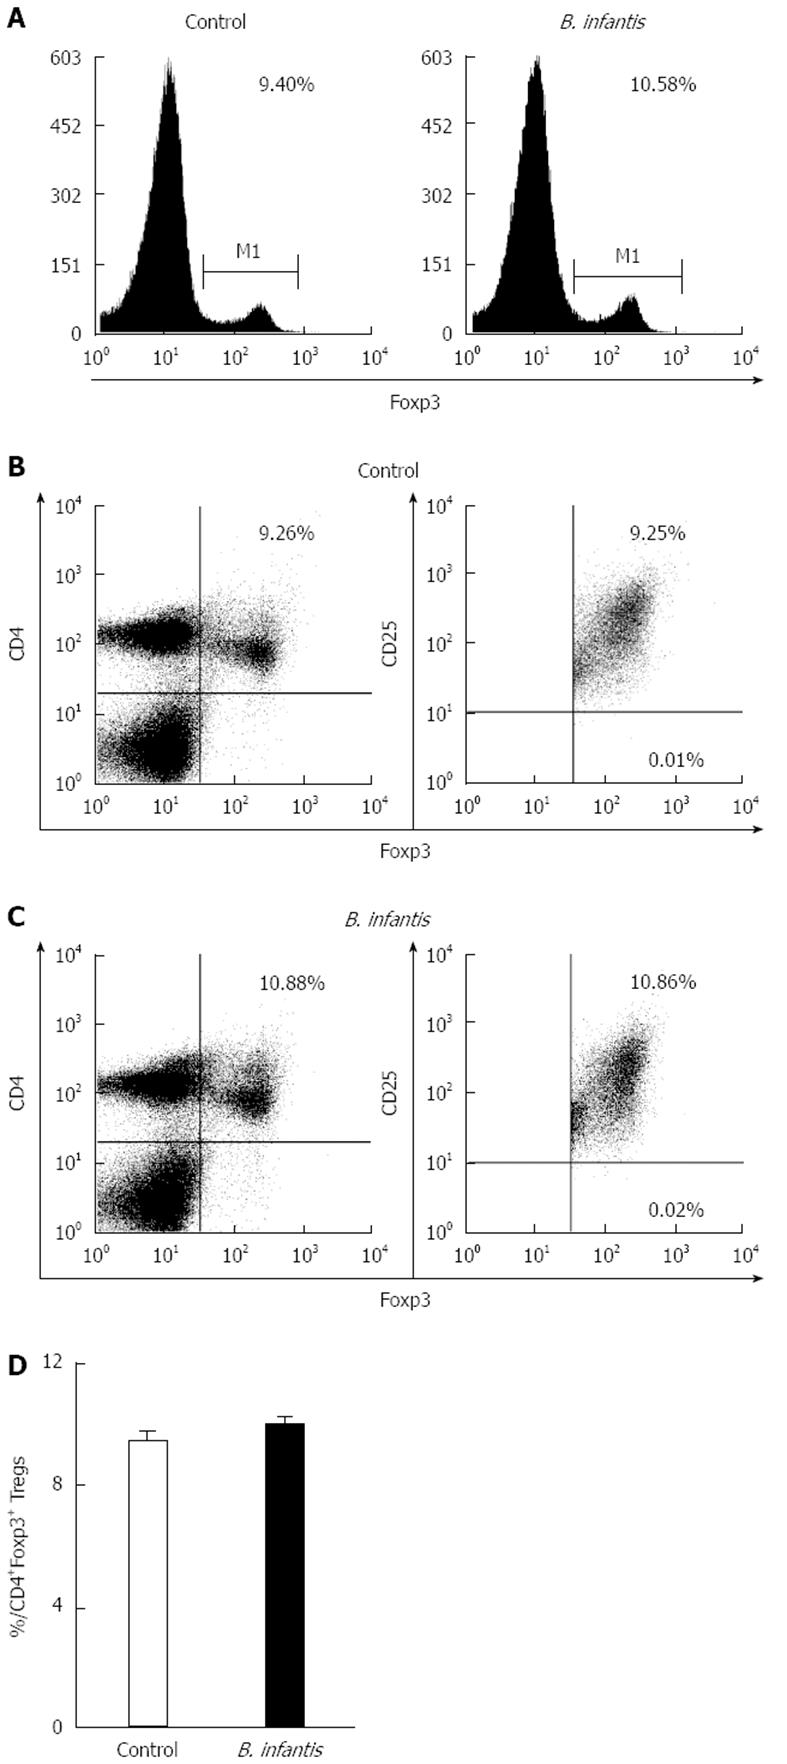
Figure 3 Representative flow plots and levels of Foxp3+ cells in mesenteric lymph nodes from normal mice fed high dose Bifidobacterium infantis.
A: Levels of Foxp3+ cells in mesenteric lymph nodes from PBS-control group and Bifidobacterium infantis (B. infantis) group; B: Levels of CD4+Foxp3+ Tregs from PBS-control group; C: Levels of CD4+Foxp3+ Tregs from B. infantis group; D: The percentage of the CD4+Foxp3+ Tregs. Data are mean ± SE with 5 mice per group from three independent experiments (bar graphs) or as a representative flow cytometry graph.
-
Citation: Zuo L, Yuan KT, Yu L, Meng QH, Chung PCK, Yang DH.
Bifidobacterium infantis attenuates colitis by regulating T cell subset responses. World J Gastroenterol 2014; 20(48): 18316-18329 - URL: https://www.wjgnet.com/1007-9327/full/v20/i48/18316.htm
- DOI: https://dx.doi.org/10.3748/wjg.v20.i48.18316


