Copyright
©2014 Baishideng Publishing Group Inc.
World J Gastroenterol. Dec 7, 2014; 20(45): 17065-17074
Published online Dec 7, 2014. doi: 10.3748/wjg.v20.i45.17065
Published online Dec 7, 2014. doi: 10.3748/wjg.v20.i45.17065
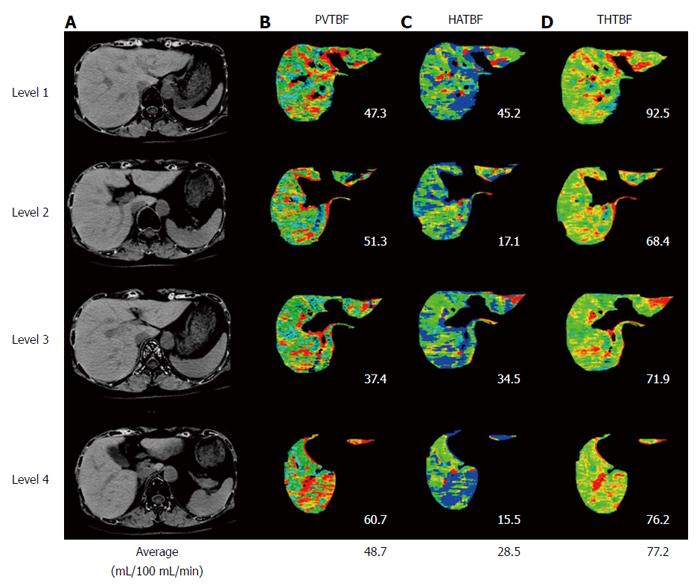
Figure 4 Measurement of hepatic tissue blood flow using xenon computed tomography.
Measurement of hepatic tissue blood flow (TBF) and confidence values obtained using xenon computed tomography (Xe-CT). Maps were created for portal venous TBF (PVTBF; B), hepatic arterial TBF (HATBF; C), the Xe solubility coefficient, and confidence values for each pixel in the liver on the basis of changes over time in the Xe-CT numbers in the hepatic tissue and spleen. A: Base line CT; B: Portal blood flow map; C: Arterial blood flow map; D: Total hepatictissue blood flow (THTBF) map.
- Citation: Takahashi H, Shigefuku R, Yoshida Y, Ikeda H, Matsunaga K, Matsumoto N, Okuse C, Sase S, Itoh F, Suzuki M. Correlation between hepatic blood flow and liver function in alcoholic liver cirrhosis. World J Gastroenterol 2014; 20(45): 17065-17074
- URL: https://www.wjgnet.com/1007-9327/full/v20/i45/17065.htm
- DOI: https://dx.doi.org/10.3748/wjg.v20.i45.17065


