Copyright
©2014 Baishideng Publishing Group Inc.
World J Gastroenterol. Dec 7, 2014; 20(45): 16964-16975
Published online Dec 7, 2014. doi: 10.3748/wjg.v20.i45.16964
Published online Dec 7, 2014. doi: 10.3748/wjg.v20.i45.16964
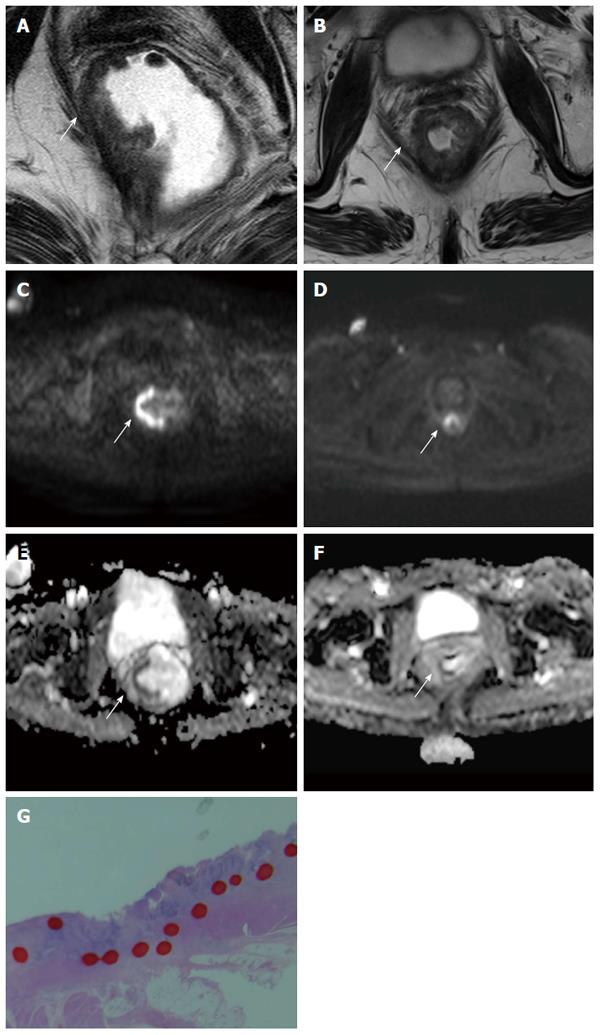
Figure 9 Seventy-one-year old female with advanced rectal cancer.
From (A) to (B), T2-weighted images show changes before and after chemo-radiation therapy. From (C) to (D), diffusion-weighted images show changes before and after chemo-radiation therapy. From (E) to (F), apparent diffusion coefficient maps show changes before and after chemo-radiation therapy. Tumor cell viability is visualized by diffusion-weighted images and apparent diffusion coefficient maps (arrow). The apparent diffusion coefficient value decreased obviously. This lesion pathologically confirmed remaining cancer cells. The apparent diffusion coefficient value is good indicator of cell viability; G: Area surrounded by the red dotted line confirmed remaining cancer cells in this patient.
- Citation: Kijima S, Sasaki T, Nagata K, Utano K, Lefor AT, Sugimoto H. Preoperative evaluation of colorectal cancer using CT colonography, MRI, and PET/CT. World J Gastroenterol 2014; 20(45): 16964-16975
- URL: https://www.wjgnet.com/1007-9327/full/v20/i45/16964.htm
- DOI: https://dx.doi.org/10.3748/wjg.v20.i45.16964


