Copyright
©2014 Baishideng Publishing Group Inc.
World J Gastroenterol. Dec 7, 2014; 20(45): 16964-16975
Published online Dec 7, 2014. doi: 10.3748/wjg.v20.i45.16964
Published online Dec 7, 2014. doi: 10.3748/wjg.v20.i45.16964
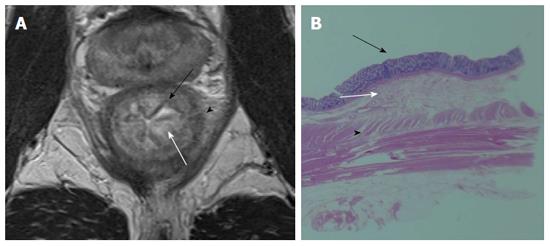
Figure 3 Mucosa is visualized by low signal intensity (black arrow), submucosa by high intensity (white arrow), and muscularis propria by low intensity (arrow head) on T2-weighted image (A) and pathological correlation between the resected specimen and magnetic resonance imaging (B).
- Citation: Kijima S, Sasaki T, Nagata K, Utano K, Lefor AT, Sugimoto H. Preoperative evaluation of colorectal cancer using CT colonography, MRI, and PET/CT. World J Gastroenterol 2014; 20(45): 16964-16975
- URL: https://www.wjgnet.com/1007-9327/full/v20/i45/16964.htm
- DOI: https://dx.doi.org/10.3748/wjg.v20.i45.16964


