Copyright
©2014 Baishideng Publishing Group Inc.
World J Gastroenterol. Nov 14, 2014; 20(42): 15910-15915
Published online Nov 14, 2014. doi: 10.3748/wjg.v20.i42.15910
Published online Nov 14, 2014. doi: 10.3748/wjg.v20.i42.15910
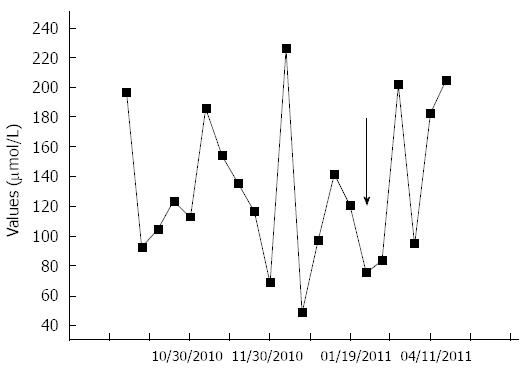
Figure 3 Ammonia values and their respective dates obtained from venous samples before and after the shunt embolization (arrow), showing that there were no major differences between the values before and after the procedure, due to the other shunts that the patient already had before the embolization.
The black arrow indicates the date of the splenorenal shunt embolization.
- Citation: Franzoni LC, Carvalho FC, Garzon RGA, Yamashiro FDS, Augusti L, Santos LAA, Dorna MS, Baima JP, Lima TB, Caramori CA, Silva GF, Romeiro FG. Embolization of splenorenal shunt associated to portal vein thrombosis and hepatic encephalopathy. World J Gastroenterol 2014; 20(42): 15910-15915
- URL: https://www.wjgnet.com/1007-9327/full/v20/i42/15910.htm
- DOI: https://dx.doi.org/10.3748/wjg.v20.i42.15910


