Copyright
©2014 Baishideng Publishing Group Inc.
World J Gastroenterol. Nov 7, 2014; 20(41): 15070-15078
Published online Nov 7, 2014. doi: 10.3748/wjg.v20.i41.15070
Published online Nov 7, 2014. doi: 10.3748/wjg.v20.i41.15070
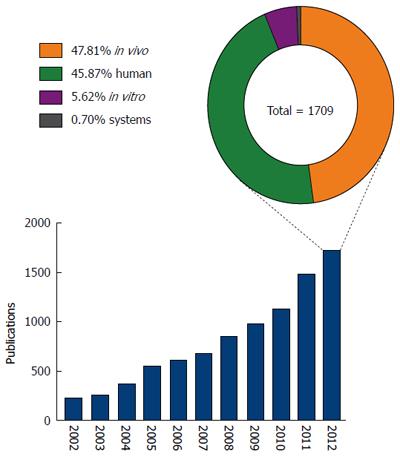
Figure 2 Non-alcoholic fatty liver disease publications and distribution of research.
Graph shows the number of journal articles published (as listed on PubMed) between 2002 and 2012 focused on non-alcoholic fatty liver disease; pie chart shows the distribution of models/approaches (human, in vivo, in vitro, systems approach) used in research published during 2012.
- Citation: Fisher CP, Kierzek AM, Plant NJ, Moore JB. Systems biology approaches for studying the pathogenesis of non-alcoholic fatty liver disease. World J Gastroenterol 2014; 20(41): 15070-15078
- URL: https://www.wjgnet.com/1007-9327/full/v20/i41/15070.htm
- DOI: https://dx.doi.org/10.3748/wjg.v20.i41.15070


