Copyright
©2014 Baishideng Publishing Group Inc.
World J Gastroenterol. Oct 28, 2014; 20(40): 14913-14920
Published online Oct 28, 2014. doi: 10.3748/wjg.v20.i40.14913
Published online Oct 28, 2014. doi: 10.3748/wjg.v20.i40.14913
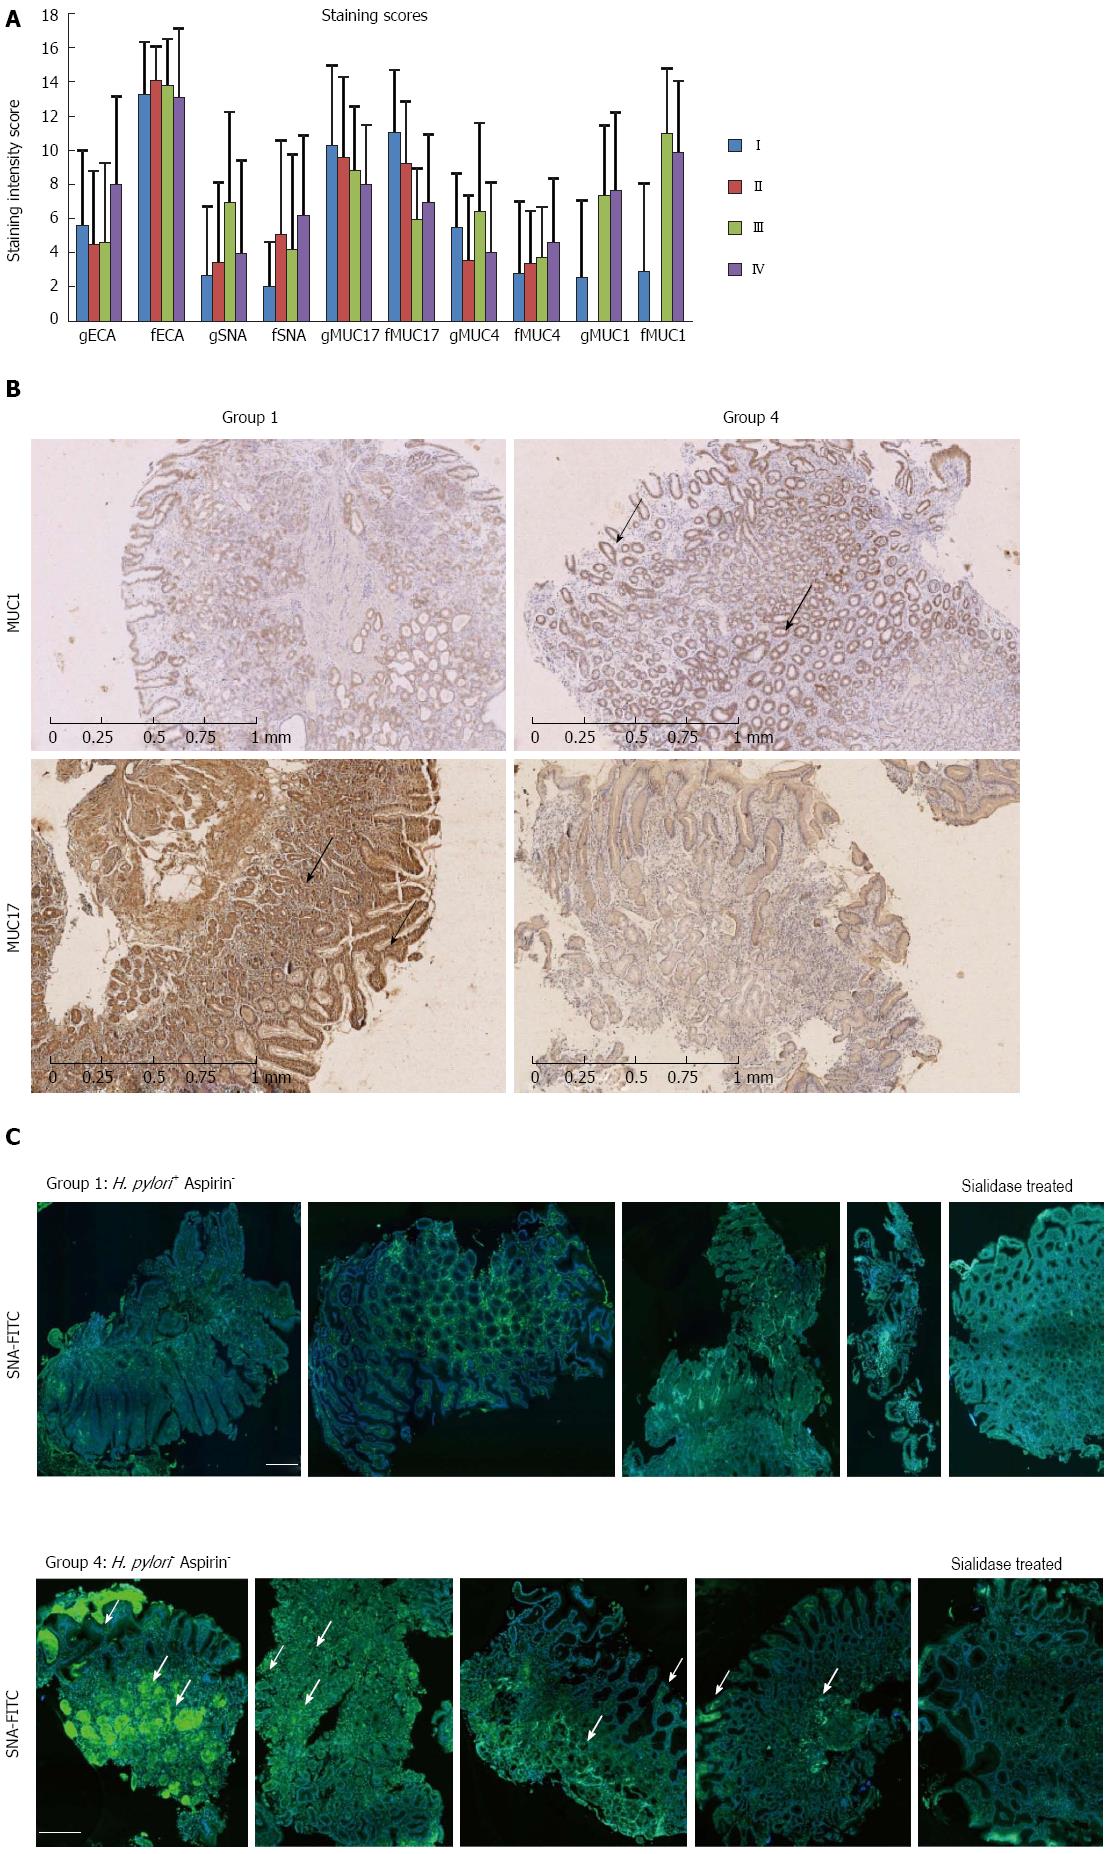
Figure 1 Membrane bound mucin and lectin expression in different gastric ulcer groups.
A: Staining scores in the different gastric ulcer groups (mean ± SD). I = group 1 = H. pylori positive/NSAID negative; II = group 2 = H. pylori negative/NSAID positive; III = group 3 = H. pylori positive/NSAID positive; IV = group 4 = H. pylori positive/NSAID negative (f = foveola, g = gland). Statistical significance was determined by two-tail T test: SNA foveola group I vs IV (P < 0.05), MUC1 foveola and gland group I vs IV (P < 0.0001), MUC17 foveola and gland group I vs IV (P < 0.0001); B: MUC1 stain is stronger in group 4 compared to group 1 in both gland (thick arrows) and foveola cells (thin arrows), in contrast, MUC17 stain is stronger in group 1 compared to group 4 in foveola (thin arrows) and to a lesser extent in gland cells (thick arrows). Scale bars = 1 mm; C: SNA-FITC lectin staining of sialic acid in α2-6 glycosidic linkage in four representative gastric ulcer samples from Group 1 (top panels) and Group 4 (lower panels). SNA-FITC staining (green color) is stronger in group 4 compared to group 1 in foveola cells (thin arrows) and in gland cells (thick arrows). No staining is observed in sialidase treated tissue, confirming SNA binding specificity. Scale bars = 250 μm. NSAID: Non-steroidal anti-inflammatory drug; SNA: Sambucus nigra agglutinin; H. pylori: Helicobacter pylori.
-
Citation: Niv Y, Boltin D, Halpern M, Cohen M, Levi Z, Vilkin A, Morgenstern S, Manugian V, Lawrence ES, Gagneux P, Kaur S, Sharma P, Batra SK, Ho SB. Membrane-bound mucins and mucin terminal glycans expression in idiopathic or
Helicobacter pylori , NSAID associated peptic ulcers. World J Gastroenterol 2014; 20(40): 14913-14920 - URL: https://www.wjgnet.com/1007-9327/full/v20/i40/14913.htm
- DOI: https://dx.doi.org/10.3748/wjg.v20.i40.14913


