Copyright
©2014 Baishideng Publishing Group Inc.
World J Gastroenterol. Sep 14, 2014; 20(34): 12202-12211
Published online Sep 14, 2014. doi: 10.3748/wjg.v20.i34.12202
Published online Sep 14, 2014. doi: 10.3748/wjg.v20.i34.12202
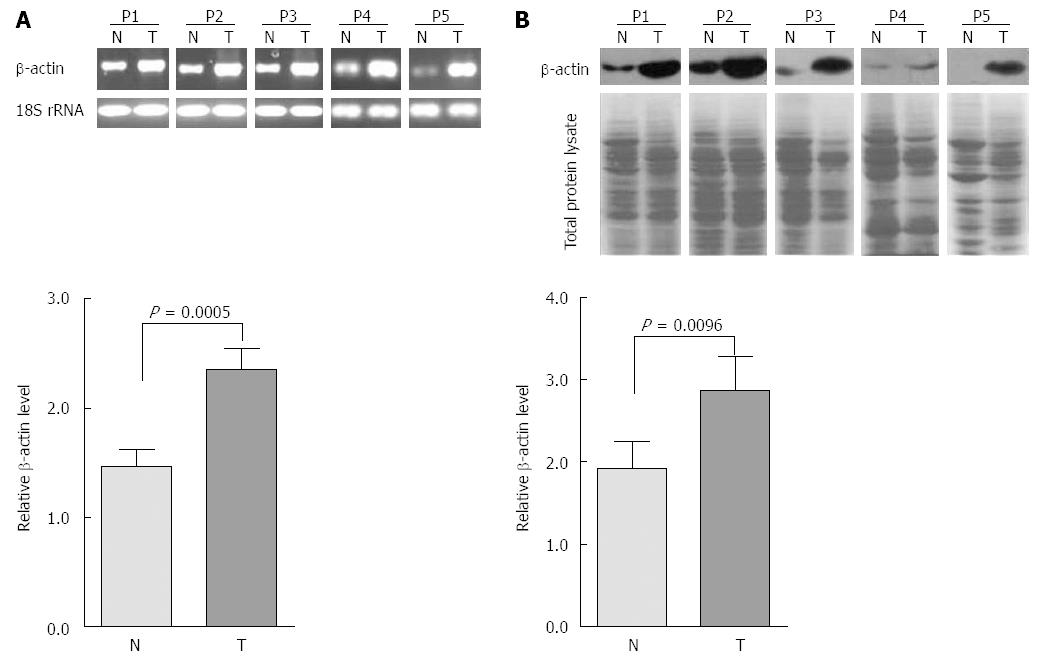
Figure 1 Comparison of overall β-actin level in gastric normal and tumor tissue (n = 5).
A: Reverse transcription polymerase chain reaction analysis of β-actin and 18S rRNA was used as an internal loading control (upper panel). Band intensities of β-actin mRNA were normalized with 18S rRNA band intensity of respective lanes and obtained values were plotted (lower panel); B: Western blot analysis of β-actin (upper panel). Band intensity of blot was normalized with the total protein lysate intensity of respective lanes and obtained values were plotted (lower panel). Statistical significance was tested using “paired t-test”. N: Normal; T: Tumor.
- Citation: Khan SA, Tyagi M, Sharma AK, Barreto SG, Sirohi B, Ramadwar M, Shrikhande SV, Gupta S. Cell-type specificity of β-actin expression and its clinicopathological correlation in gastric adenocarcinoma. World J Gastroenterol 2014; 20(34): 12202-12211
- URL: https://www.wjgnet.com/1007-9327/full/v20/i34/12202.htm
- DOI: https://dx.doi.org/10.3748/wjg.v20.i34.12202


