Copyright
©2014 Baishideng Publishing Group Inc.
World J Gastroenterol. Aug 28, 2014; 20(32): 11326-11332
Published online Aug 28, 2014. doi: 10.3748/wjg.v20.i32.11326
Published online Aug 28, 2014. doi: 10.3748/wjg.v20.i32.11326
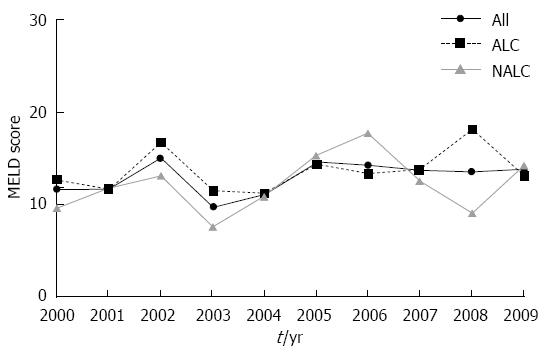
Figure 1 Mean model of end stage liver disease scores for study population per year.
P value = 0.20 reflects trend for MELD scores for cirrhosis of all causes. P value = 0.27 reflects comparison of ALC and NALC groups. MELD: Model for end-stage liver disease; All: Cirrhosis all causes; ALC: Alcoholic cirrhosis; NALC: Non-alcoholic cirrhosis.
- Citation: Lim N, Desarno MJ, Lidofsky SD, Ganguly E. Hospitalization for variceal hemorrhage in an era with more prevalent cirrhosis. World J Gastroenterol 2014; 20(32): 11326-11332
- URL: https://www.wjgnet.com/1007-9327/full/v20/i32/11326.htm
- DOI: https://dx.doi.org/10.3748/wjg.v20.i32.11326


