Copyright
©2014 Baishideng Publishing Group Co.
World J Gastroenterol. Jan 21, 2014; 20(3): 795-803
Published online Jan 21, 2014. doi: 10.3748/wjg.v20.i3.795
Published online Jan 21, 2014. doi: 10.3748/wjg.v20.i3.795
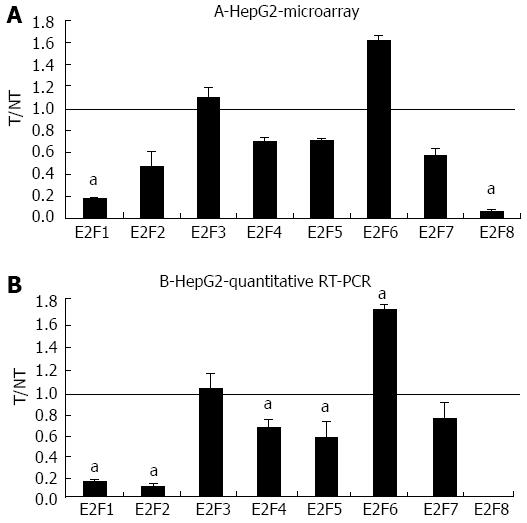
Figure 2 Microarray and quantitative real-time reverse transcription polymerase chain reaction assays in HepG2 following bortezomib treatment.
A: The mRNA levels of the indicated E2Fs were evaluated by microarray analysis two days after JHH6 treatment with 40 nmol/L bortezomib. Data are reported as ratio between treated cells (T) and non-treated cells (NT); data are shown as means ± SEM aP < 0.05 vs controls; depending on the E2F member the number of evaluation ranged from three up to ten. B: The mRNA levels of the indicated E2Fs were evaluated by quantitative real-time reverse transcription polymerase chain assay; data, normalized to GAPDH mRNA, are shown as ratio between T and NT; data are reported as means ± SEM; aP < 0.05 vs controls, n = 5. RT-PCR: Reverse transcription polymerase chain reaction.
- Citation: Baiz D, Dapas B, Farra R, Scaggiante B, Pozzato G, Zanconati F, Fiotti N, Consoloni L, Chiaretti S, Grassi G. Bortezomib effect on E2F and cyclin family members in human hepatocellular carcinoma cell lines. World J Gastroenterol 2014; 20(3): 795-803
- URL: https://www.wjgnet.com/1007-9327/full/v20/i3/795.htm
- DOI: https://dx.doi.org/10.3748/wjg.v20.i3.795


