Copyright
©2014 Baishideng Publishing Group Inc.
World J Gastroenterol. Aug 7, 2014; 20(29): 10071-10081
Published online Aug 7, 2014. doi: 10.3748/wjg.v20.i29.10071
Published online Aug 7, 2014. doi: 10.3748/wjg.v20.i29.10071
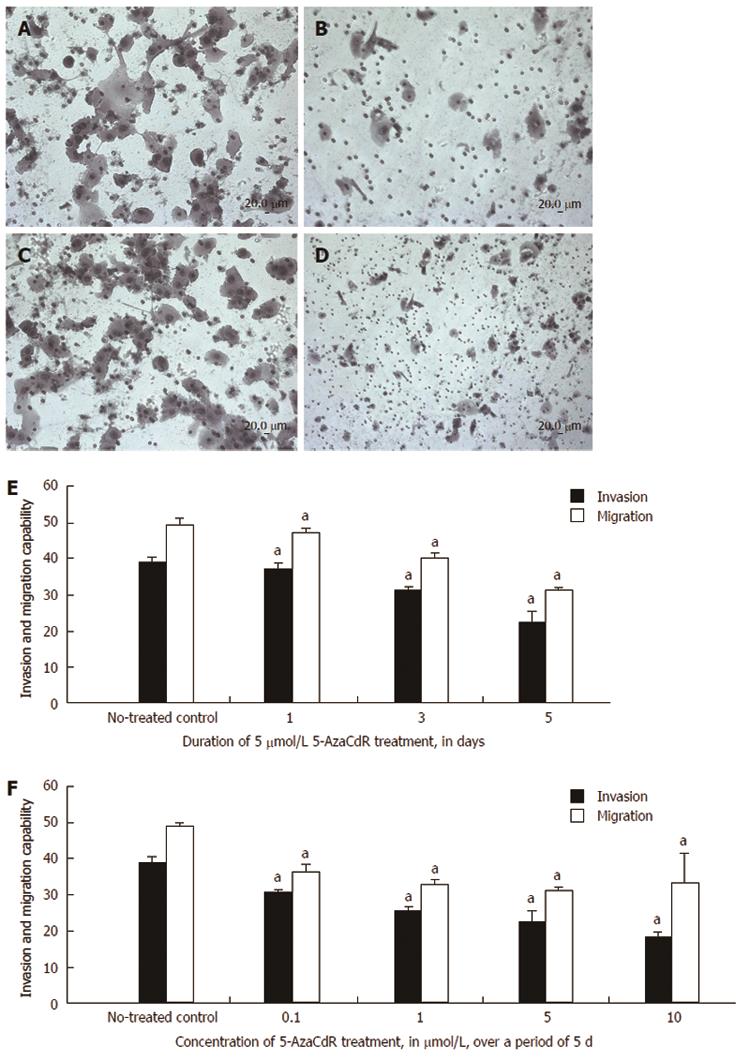
Figure 6 Changes in HCT116 cell invasion and migration after 5-Aza-CdR treatment.
A: The invasion of untreated HCT116 cells was determined using a Matrigel invasion assay; B: HCT116 cell invasion in one well after treatment with 5-Aza-CdR; C: Cell migration was determined in untreated cells using a migration assay; D: Cell migration after treatment with 5-Aza-CdR; E: HCT116 cell invasion and migration gradually decreased in a time-dependent manner after treatment; F: HCT116 cell invasion and migration gradually declined with increasing concentrations of 5-Aza-CdR. Each bar represents the mean of 3 independent wells. Scale bar, 20 μm. aP < 0.05 vs non-treated control.
-
Citation: Chen SQ, Chen ZH, Lin SY, Dai QB, Fu LX, Chen RQ.
KISS1 methylation and expression as predictors of disease progression in colorectal cancer patients. World J Gastroenterol 2014; 20(29): 10071-10081 - URL: https://www.wjgnet.com/1007-9327/full/v20/i29/10071.htm
- DOI: https://dx.doi.org/10.3748/wjg.v20.i29.10071


