Copyright
©2014 Baishideng Publishing Group Inc.
World J Gastroenterol. Jul 14, 2014; 20(26): 8583-8591
Published online Jul 14, 2014. doi: 10.3748/wjg.v20.i26.8583
Published online Jul 14, 2014. doi: 10.3748/wjg.v20.i26.8583
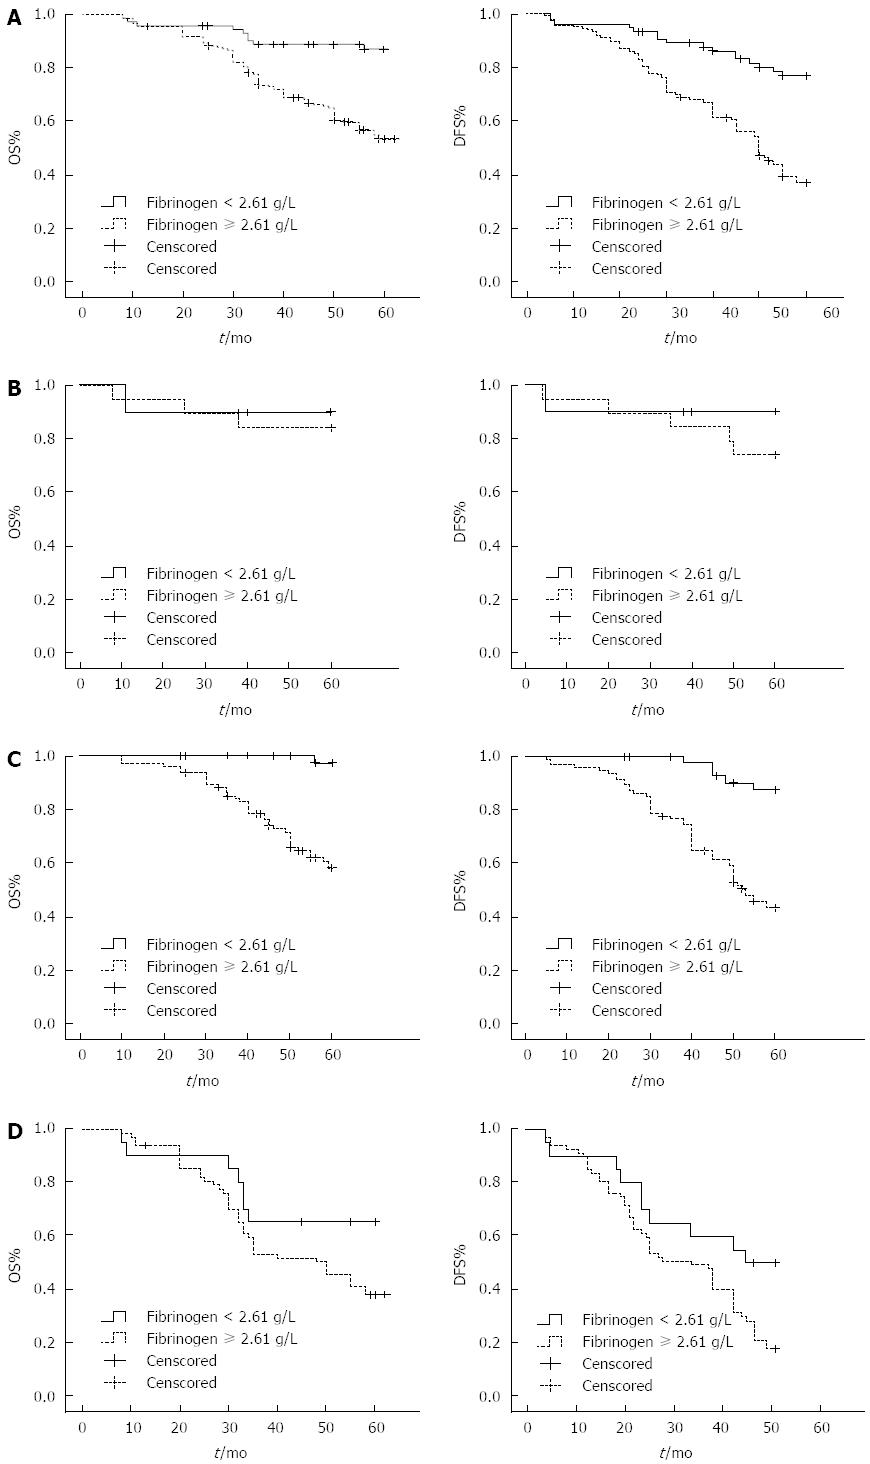
Figure 1 Kaplan-Meier curves of hyperfibrinogen and hypofibrinogen colon cancer groups.
A: Entire patient cohort; B: Stage I; C: Stage II; D: Stage III. 1 and 2 stand for the 5-yr overall survival (OS) and 5-yr disease-free survival (DFS), respectively. Both OS and DFS of the entire cohort, stage II, and stage III patients were significantly higher in the hypofibrinogen (< 2.61 g/L) group than in the hyperfibrinogen (≥ 2.61 g/L) group (P < 0.05).
- Citation: Sun ZQ, Han XN, Wang HJ, Tang Y, Zhao ZL, Qu YL, Xu RW, Liu YY, Yu XB. Prognostic significance of preoperative fibrinogen in patients with colon cancer. World J Gastroenterol 2014; 20(26): 8583-8591
- URL: https://www.wjgnet.com/1007-9327/full/v20/i26/8583.htm
- DOI: https://dx.doi.org/10.3748/wjg.v20.i26.8583


