Copyright
©2014 Baishideng Publishing Group Inc.
World J Gastroenterol. Jul 14, 2014; 20(26): 8491-8504
Published online Jul 14, 2014. doi: 10.3748/wjg.v20.i26.8491
Published online Jul 14, 2014. doi: 10.3748/wjg.v20.i26.8491
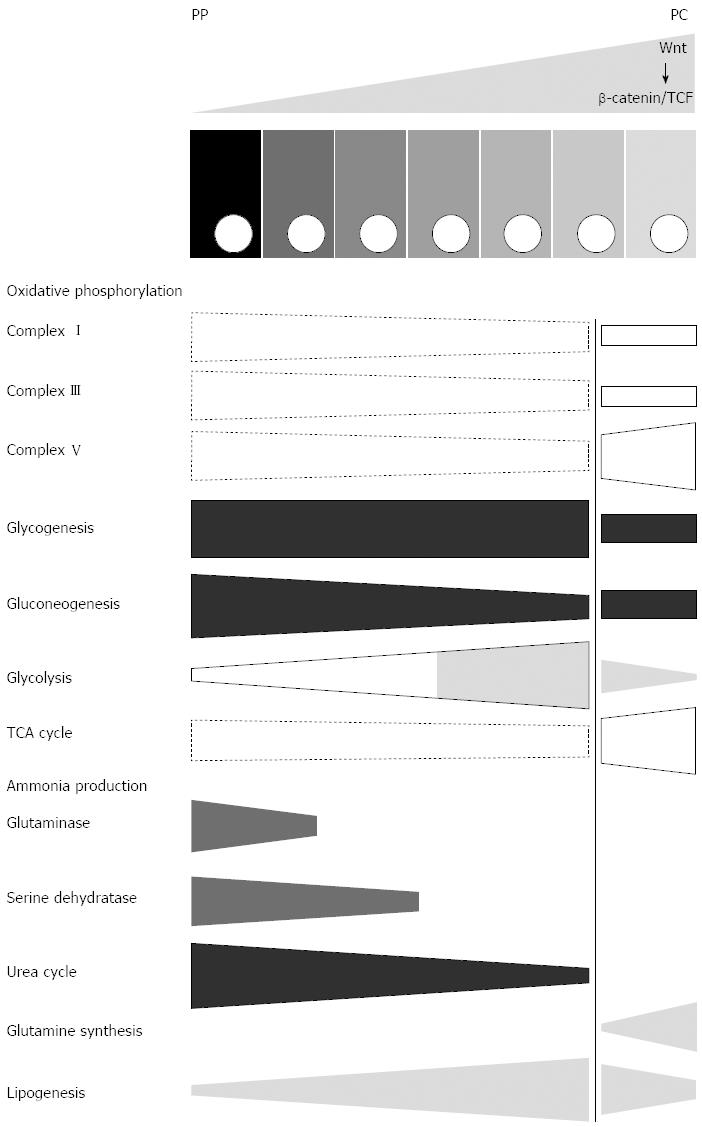
Figure 2 Scheme illustrating aspects of zonation of central metabolism in normal mice.
Selected functions of central metabolism are depicted as conical boxes showing the direction of their porto-central gradients with specific emphasis of the strength of this gradient in the glutamine synthetase-positive zone (right of the vertical line). Dashed boxes indicate gradients that have been determined using a single method only (proteome analysis), instead of at least two independent methods (other boxes). Since the data is valid for normal mice, the presumably corresponding gradient of Wnt/β-catenin signalling is depicted at the top of the scheme, above the row of the hepatocytes. PP: Periportal; PC: Pericentral.
- Citation: Gebhardt R, Matz-Soja M. Liver zonation: Novel aspects of its regulation and its impact on homeostasis. World J Gastroenterol 2014; 20(26): 8491-8504
- URL: https://www.wjgnet.com/1007-9327/full/v20/i26/8491.htm
- DOI: https://dx.doi.org/10.3748/wjg.v20.i26.8491


