Copyright
©2014 Baishideng Publishing Group Inc.
World J Gastroenterol. Jul 7, 2014; 20(25): 8119-8129
Published online Jul 7, 2014. doi: 10.3748/wjg.v20.i25.8119
Published online Jul 7, 2014. doi: 10.3748/wjg.v20.i25.8119
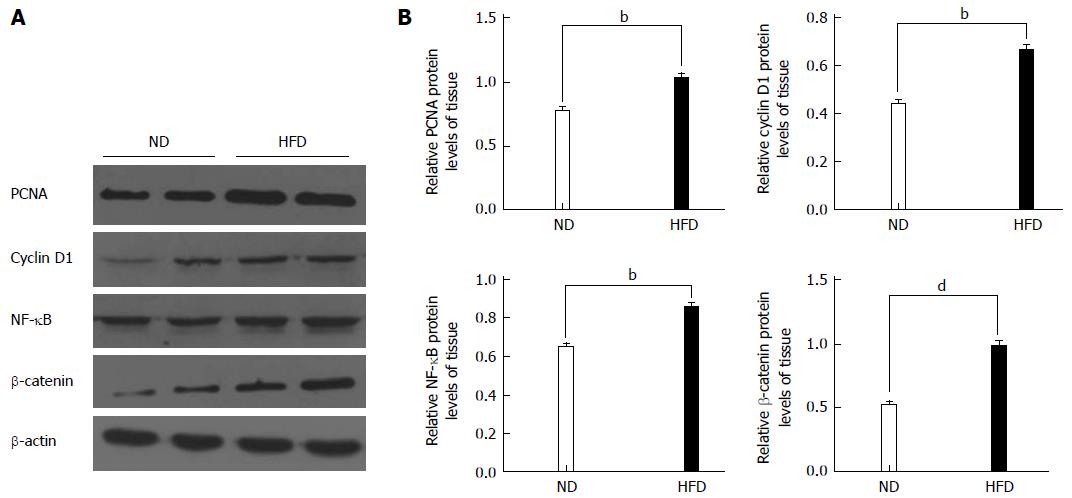
Figure 6 Western blot analyses for proliferating cell nuclear antigen, cyclin D1, nuclear factor-kappa B and β-catenin.
A: Representative Western blotting images are shown in the left panel (n = 8/group); B: Right panel: graphs showing the expression ratio of each protein over β-actin in the high-fat diet (HFD) group compared with the normal-fat diet (ND) group. bP < 0.01, dP < 0.01, HFD group vs ND group. PCNA: Proliferating cell nuclear antigen; NF-κB: Nuclear factor-kappa B.
- Citation: Zhu QC, Gao RY, Wu W, Guo BM, Peng JY, Qin HL. Effect of a high-fat diet in development of colonic adenoma in an animal model. World J Gastroenterol 2014; 20(25): 8119-8129
- URL: https://www.wjgnet.com/1007-9327/full/v20/i25/8119.htm
- DOI: https://dx.doi.org/10.3748/wjg.v20.i25.8119


