Copyright
©2014 Baishideng Publishing Group Inc.
World J Gastroenterol. Jul 7, 2014; 20(25): 8119-8129
Published online Jul 7, 2014. doi: 10.3748/wjg.v20.i25.8119
Published online Jul 7, 2014. doi: 10.3748/wjg.v20.i25.8119
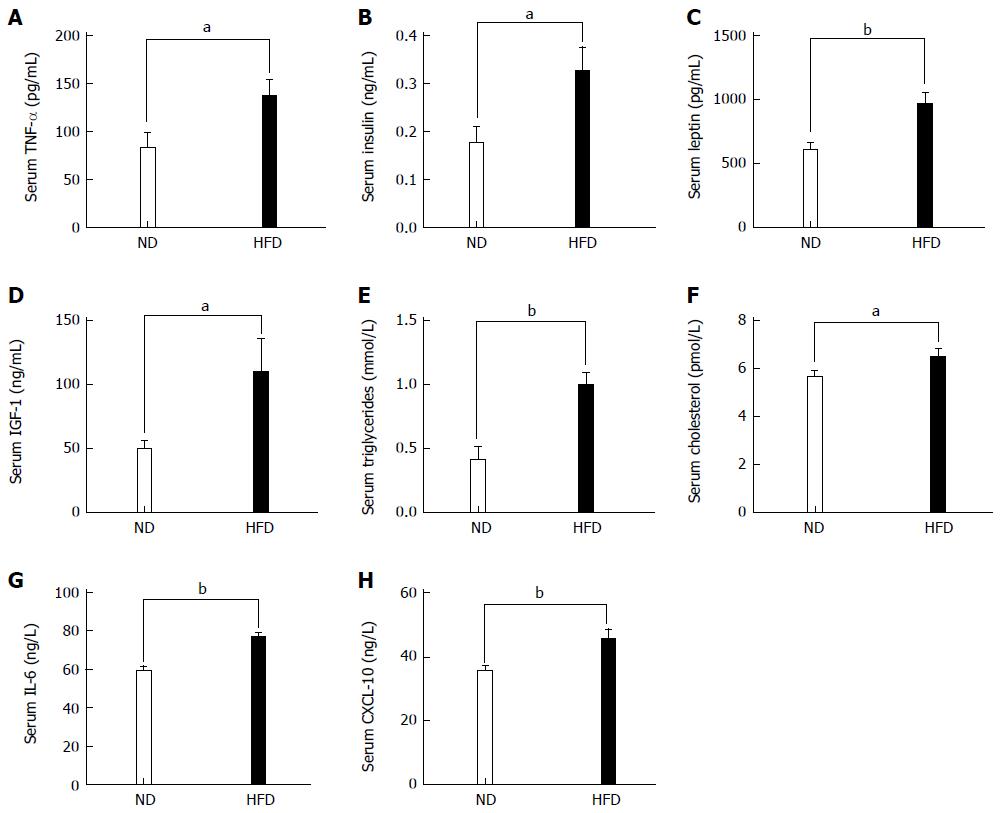
Figure 4 Levels of biochemical indices and inflammatory cytokines in serum between normal-fat diet and high-fat diet groups.
Each column represents the mean ± SD; (n = 10/group). A: Levels of TNF-α (86.62 ± 15.77 vs 136.60 ± 17.60, P = 0.034); B: Levels of insulin (0.176 ± 0.03 vs 0.326 ± 0.05, P = 0.024); C: Levels of leptin (608.70 ± 172.0 vs 966.90 ± 239.0, P = 0.002); D: Levels of IGF-1 (49.46 ± 16.74 vs 110.0 ± 26.29, P = 0.045); E: Levels of triglycerides (0.406 ± 0.108 vs 0.992 ± 0.097, P = 0.002); F: Levels of cholesterol (5.645 ± 0.82 vs 6.486 ± 1.06, P = 0.044); G: Levels of IL-6 (59.08 ± 8.405 vs 76.83 ± 7.310, P = 0.004); H: Levels of CXCL-10 (35.47 ± 5.04 vs 45.57 ± 9.45, P = 0.008). TNF-α: Tumor necrosis factor α; IGF-1: Insulin growth factor 1. IL-6: Interlukin-6; CXCL-10: Chemokine-10. (aP < 0.05, bP < 0.01, ND vs HFD).
- Citation: Zhu QC, Gao RY, Wu W, Guo BM, Peng JY, Qin HL. Effect of a high-fat diet in development of colonic adenoma in an animal model. World J Gastroenterol 2014; 20(25): 8119-8129
- URL: https://www.wjgnet.com/1007-9327/full/v20/i25/8119.htm
- DOI: https://dx.doi.org/10.3748/wjg.v20.i25.8119


