Copyright
©2014 Baishideng Publishing Group Inc.
World J Gastroenterol. Jul 7, 2014; 20(25): 8119-8129
Published online Jul 7, 2014. doi: 10.3748/wjg.v20.i25.8119
Published online Jul 7, 2014. doi: 10.3748/wjg.v20.i25.8119
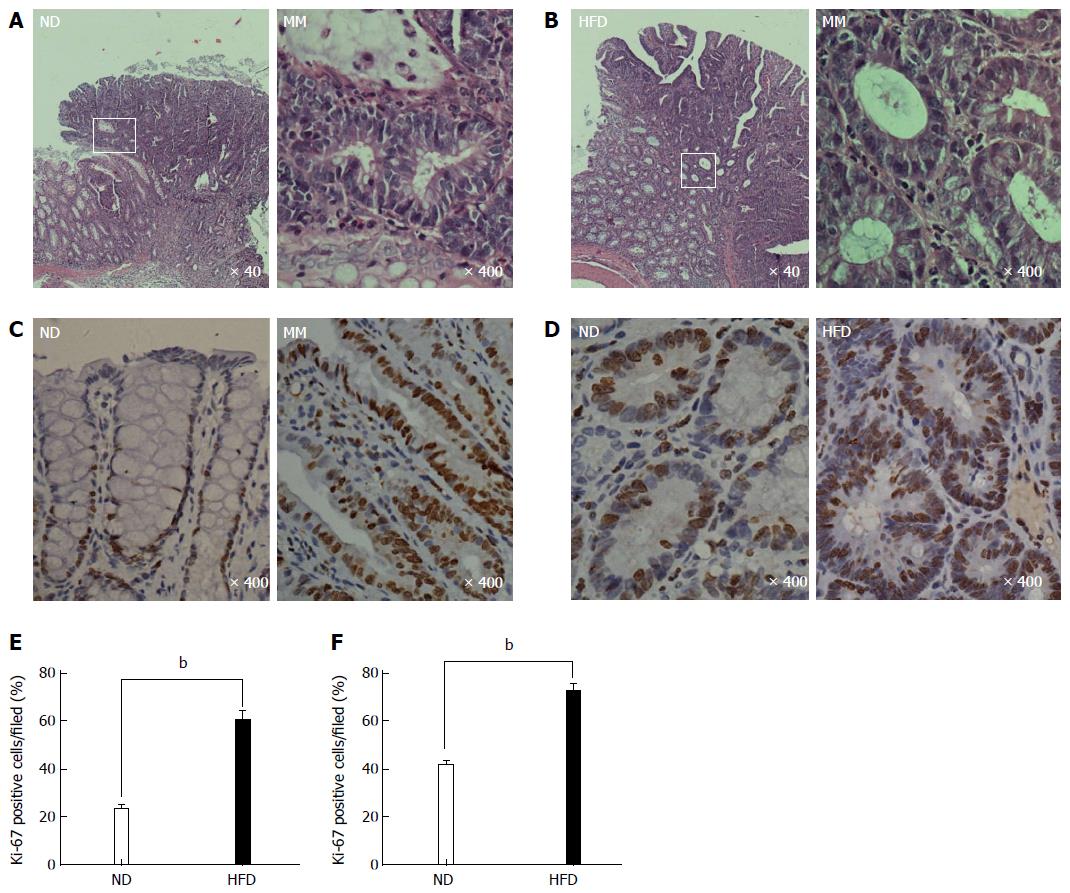
Figure 3 Representative photomicrographs showing the histological characteristics and proliferative state of colonic adenoma.
A and B: Histological characteristics of colonic adenoma in the normal-fat diet/high-fat diet (ND/HFD) groups, and the magnified micrograph (right) highlights the area from the corresponding white rectangle (left); C and D: Representative immunohistochemical staining of proliferative activity (Ki-67, brown) of colonic epithelial cells in the ND/HFD groups; C: Adjacent normal epithelial cells; D; Colonic adenoma tissue; E and F: Ki-67-positive cells were quantified for adjacent normal epithelium (E) and adenoma tissue (F) by counting the positive cells per field (n = 5 per group, bP < 0.01, HFD-fed vs ND-fed). The magnification is marked in the lower right of the pictures, respectively. MM: Magnified micrograph.
- Citation: Zhu QC, Gao RY, Wu W, Guo BM, Peng JY, Qin HL. Effect of a high-fat diet in development of colonic adenoma in an animal model. World J Gastroenterol 2014; 20(25): 8119-8129
- URL: https://www.wjgnet.com/1007-9327/full/v20/i25/8119.htm
- DOI: https://dx.doi.org/10.3748/wjg.v20.i25.8119


