Copyright
©2014 Baishideng Publishing Group Inc.
World J Gastroenterol. Jul 7, 2014; 20(25): 8119-8129
Published online Jul 7, 2014. doi: 10.3748/wjg.v20.i25.8119
Published online Jul 7, 2014. doi: 10.3748/wjg.v20.i25.8119
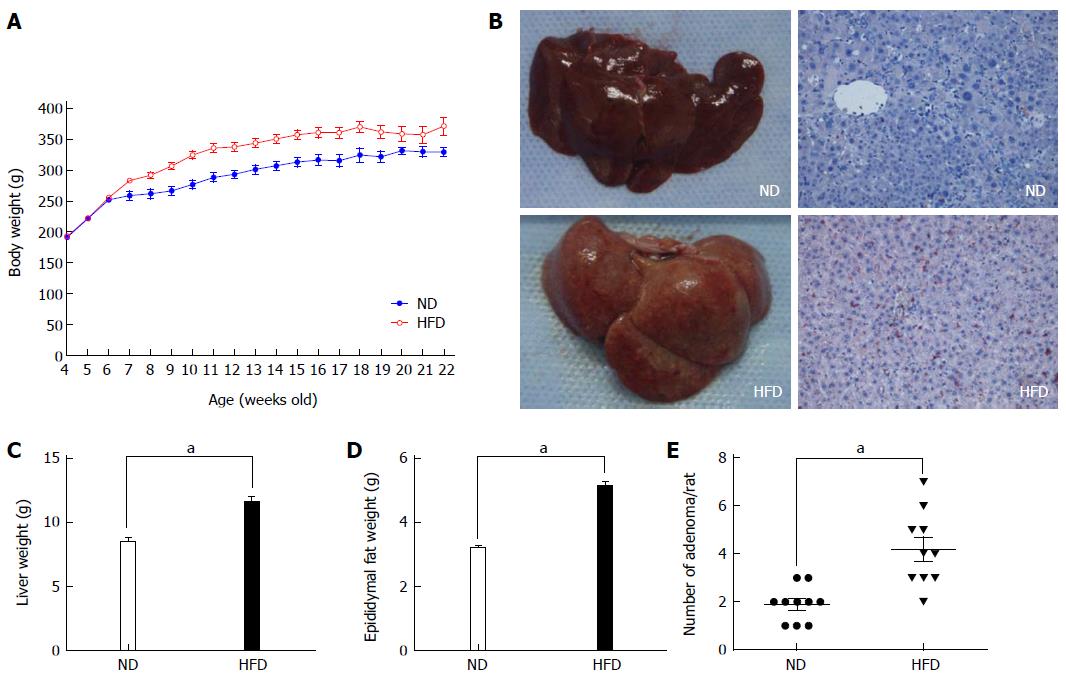
Figure 2 Changes in body weight and representative images of the liver.
A: Changes in body weight of rats fed a normal-fat diet (ND) (blue line, n = 10) and high-fat diet (HFD) (red line, n = 10). Significant differences were observed between the ND and HFD groups at all time points except for the initial 2 wk; B: Representative images of the liver from the ND group (left) and HFD group (right). The liver from the HFD group appeared to have a fatty liver-like appearance, and the Oil Red O staining also present that there are more lipid droplets in the cytoplasm of liver cells. Imaging was documented at × 200 magnification; C: Average weight of the liver from the two groups. Each column represents the mean ± SD of 10 rats/group; D: Average weight of epididymal fat from the two groups. Each column represents the mean ± SD of 10 rats/group. aP < 0.01, ND vs HFD; E: Average number of adenomas for rats fed an ND and HFD.
- Citation: Zhu QC, Gao RY, Wu W, Guo BM, Peng JY, Qin HL. Effect of a high-fat diet in development of colonic adenoma in an animal model. World J Gastroenterol 2014; 20(25): 8119-8129
- URL: https://www.wjgnet.com/1007-9327/full/v20/i25/8119.htm
- DOI: https://dx.doi.org/10.3748/wjg.v20.i25.8119


