Copyright
©2014 Baishideng Publishing Group Inc.
World J Gastroenterol. Jul 7, 2014; 20(25): 8061-8071
Published online Jul 7, 2014. doi: 10.3748/wjg.v20.i25.8061
Published online Jul 7, 2014. doi: 10.3748/wjg.v20.i25.8061
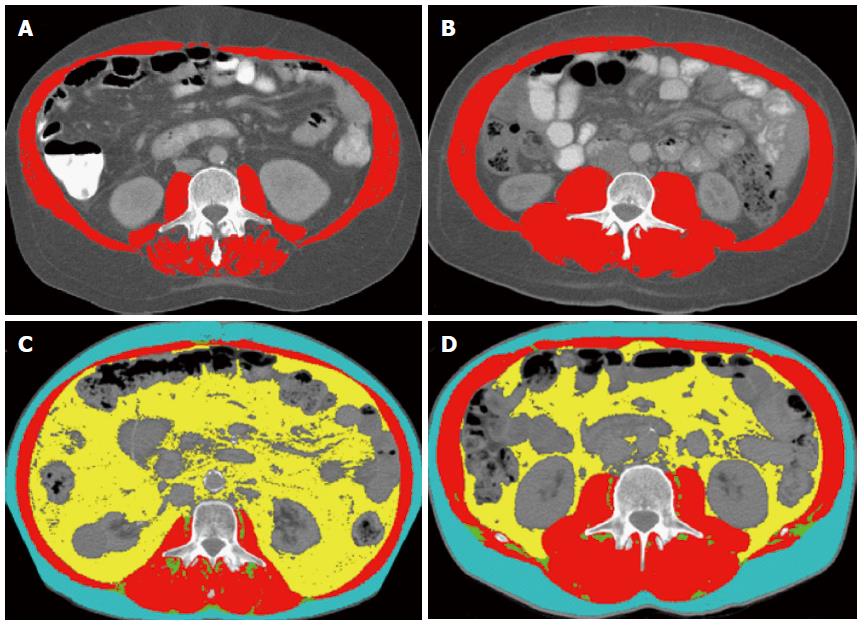
Figure 1 Computed tomography images used for the 3rd lumbar skeletal muscle Index assessment of two patients with cirrhosis (A, B), and two patients with cirrhosis and hepatocellular carcinoma (C, D).
Comparison of two cirrhotic patients with identical body mass index (BMI 32 kg/m2), and two patients with cirrhosis and hepatocellular carcinoma and identical BMI (28 kg/m2). A: The patient at the left is sarcopenic with the 3rd lumbar (L3) skeletal muscle index (L3 SMI) of 50 cm2/m2; B: Patient at the right is not sarcopenic with a L3 SMI of 71 cm2/m2; C: Patient at the left is sarcopenic with L3 SMI of 47 cm2/m2; D: Patient at the right is not sarcopenic with a L3 SMI of 59 cm2/m2. Red color indicates skeletal muscles, green color indicates intermuscular adipose tissue, yellow color indicates visceral adipose tissue, and teal indicates subcutaneous adipose tissue.
- Citation: Montano-Loza AJ. Clinical relevance of sarcopenia in patients with cirrhosis. World J Gastroenterol 2014; 20(25): 8061-8071
- URL: https://www.wjgnet.com/1007-9327/full/v20/i25/8061.htm
- DOI: https://dx.doi.org/10.3748/wjg.v20.i25.8061


