Copyright
©2014 Baishideng Publishing Group Inc.
World J Gastroenterol. Jun 28, 2014; 20(24): 7964-7970
Published online Jun 28, 2014. doi: 10.3748/wjg.v20.i24.7964
Published online Jun 28, 2014. doi: 10.3748/wjg.v20.i24.7964
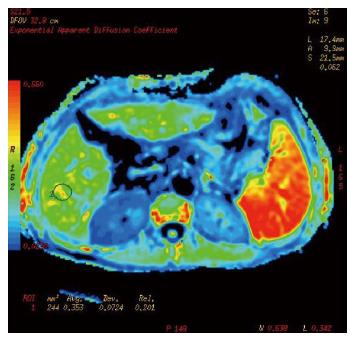
Figure 3 Exponential apparent diffusion coefficient pseudo-color pictures.
Exponential apparent diffusion coefficient image: Diffuse restricted tissues manifest higher signal intensity, free diffuse tissues manifest low signal intensity, and the effect of filtration efficiency of T2 is excluded (b = 700 s/mm2).
- Citation: Hu XR, Cui XN, Hu QT, Chen J. Value of MR diffusion imaging in hepatic fibrosis and its correlations with serum indices. World J Gastroenterol 2014; 20(24): 7964-7970
- URL: https://www.wjgnet.com/1007-9327/full/v20/i24/7964.htm
- DOI: https://dx.doi.org/10.3748/wjg.v20.i24.7964


