Copyright
©2014 Baishideng Publishing Group Inc.
World J Gastroenterol. Jun 21, 2014; 20(23): 7442-7451
Published online Jun 21, 2014. doi: 10.3748/wjg.v20.i23.7442
Published online Jun 21, 2014. doi: 10.3748/wjg.v20.i23.7442
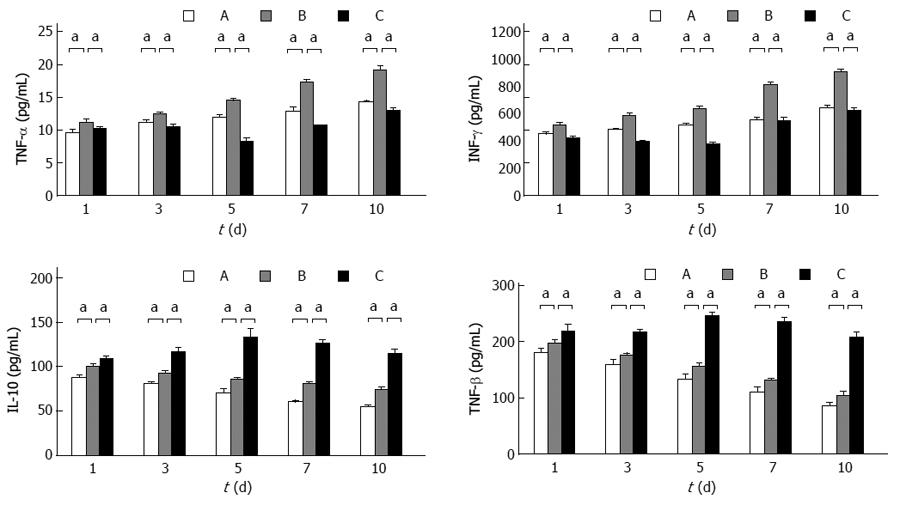
Figure 6 Graft tumor necrosis factor-α, interferon-γ, interleukin-10, and transforming growth factor-β levels.
Graft tumor necrosis factor-α (TNF-α), interferon-γ (INF-γ), interleukin-10 (IL-10), and transforming growth factor-β (TGF-β) levels in group B were significantly decreased compared to that in group A at day 7 (17.2128 ± 0.4991 vs 12.8364 ± 0.7131, P < 0.05; 810.2637 ± 25.1175 vs 555.3763 ± 17.9702, P < 0.05; 80.3756 ± 2.5866 vs 59.9878 ± 2.1521, P < 0.05; 130.8756 ± 3.3428 vs 109.9878 ± 9.7968, P < 0.05). Graft TNF-α and IFN-γ levels in group C were significantly decreased compared to that in group B at day 7 (10.6473 ± 0.0710 vs 17.2128 ± 0.4991, P < 0.05; 545.1506 ± 31.9416 vs 810.2637 ± 25.1175, P < 0.05); graft IL-10 and TGF-β levels in group C were significantly increased compared to that in group B at day 7 (125.7773 ± 4.7719 vs 80.3756 ± 2.5866, P < 0.05; 234.5273 ± 9.3980 vs 545.1506 ± 31.9416, P < 0.05). A: Group A (non-rejection); B: Group B (rejection); C: Group C (BM MSC therapy). All values are mean ± SD (n = 6). aP < 0.05 vs group B.
- Citation: Zhang W, Shen ZY, Song HL, Yang Y, Wu BJ, Fu NN, Liu T. Protective effect of bone marrow mesenchymal stem cells in intestinal barrier permeability after heterotopic intestinal transplantation. World J Gastroenterol 2014; 20(23): 7442-7451
- URL: https://www.wjgnet.com/1007-9327/full/v20/i23/7442.htm
- DOI: https://dx.doi.org/10.3748/wjg.v20.i23.7442


