Copyright
©2014 Baishideng Publishing Group Co.
World J Gastroenterol. May 7, 2014; 20(17): 5036-5044
Published online May 7, 2014. doi: 10.3748/wjg.v20.i17.5036
Published online May 7, 2014. doi: 10.3748/wjg.v20.i17.5036
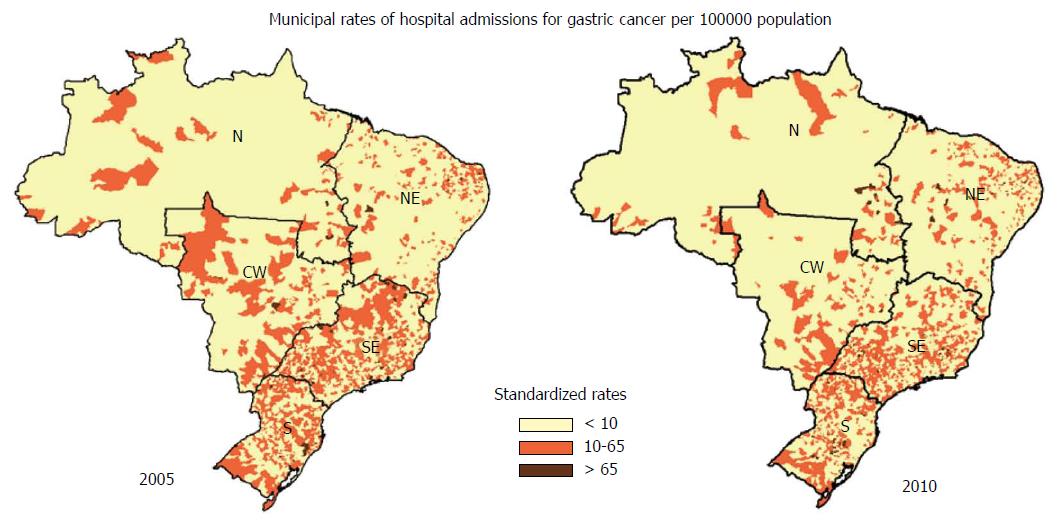
Figure 4 Geographic distribution of gastric cancer in Brazil according to the municipal hospitalization rates (per 100000 inhabitants) in the years of 2005 and 2010.
Standardized rates defined three ranges of 0-10, 10-65 and > 65. S: South; SE: Southeast; N: North; NE: Northeast; CW: Central-west.
- Citation: Amorim CA, Moreira JP, Rial L, Carneiro AJ, Fogaça HS, Elia C, Luiz RR, de Souza HSP. Ecological study of gastric cancer in Brazil: Geographic and time trend analysis. World J Gastroenterol 2014; 20(17): 5036-5044
- URL: https://www.wjgnet.com/1007-9327/full/v20/i17/5036.htm
- DOI: https://dx.doi.org/10.3748/wjg.v20.i17.5036


