Copyright
©2014 Baishideng Publishing Group Co.
World J Gastroenterol. Apr 21, 2014; 20(15): 4440-4445
Published online Apr 21, 2014. doi: 10.3748/wjg.v20.i15.4440
Published online Apr 21, 2014. doi: 10.3748/wjg.v20.i15.4440
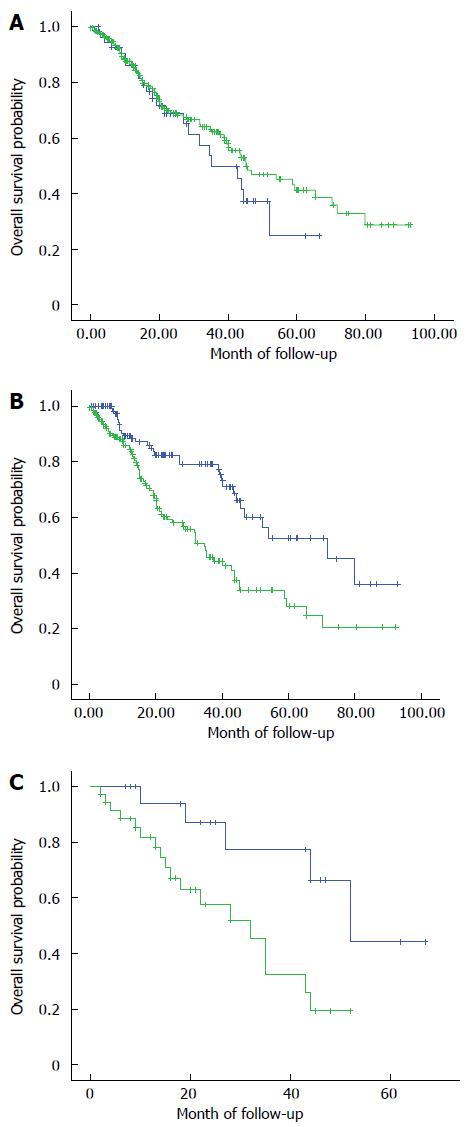
Figure 2 Kaplan-Meier overall survival curves.
A: Kaplan-Meier overall survival curves for the 300 colorectal cancer patients, according to immunohistochemical detection of human epidermal growth factor receptor 2 normal (green) and overexpression (blue). The difference between the curves did not reach statistical significance (P = 0.344); B: Kaplan-Meier overall survival curves for the 300 colorectal cancer patients, according to immunohistochemical detection of death decoy receptor normal (green) and overexpression (blue). The difference between the curves was significant (P < 0.001); C: Kaplan-Meier overall survival curves for the 300 colorectal cancer patients, according to immunohistochemical detection of human epidermal growth factor receptor 2 overexpression in isolation (blue) or coincident with (green) death decoy receptor overexpression. The difference between the curves was significant (P = 0.006).
- Citation: Zong L, Chen P, Wang DX. Death decoy receptor overexpression and increased malignancy risk in colorectal cancer. World J Gastroenterol 2014; 20(15): 4440-4445
- URL: https://www.wjgnet.com/1007-9327/full/v20/i15/4440.htm
- DOI: https://dx.doi.org/10.3748/wjg.v20.i15.4440


