Copyright
©2014 Baishideng Publishing Group Co.
World J Gastroenterol. Apr 21, 2014; 20(15): 4345-4352
Published online Apr 21, 2014. doi: 10.3748/wjg.v20.i15.4345
Published online Apr 21, 2014. doi: 10.3748/wjg.v20.i15.4345
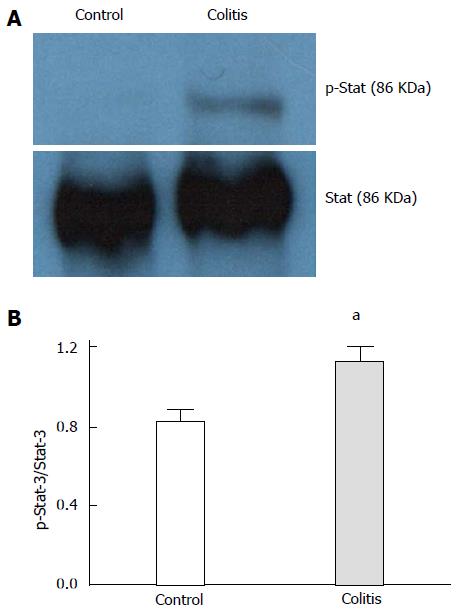
Figure 2 Stat-3 phosphorylation levels in control and colitic rats.
A: Representative Western blot images (from one individual experiment); B: Bar graph densitometry quantifications of phospho-Stat-3 expression levels that were normalized to colonic Stat-3 expression levels (n = 4 per group). Data are expressed as the means ± SE, and aP < 0.05 compared with control.
- Citation: Gotardo &MF, Ribeiro GA, Clemente TRL, Moscato CH, Tomé RBG, Rocha T, Pedrazzoli Jr J, Ribeiro ML, Gambero A. Hepcidin expression in colon during trinitrobenzene sulfonic acid-induced colitis in rats. World J Gastroenterol 2014; 20(15): 4345-4352
- URL: https://www.wjgnet.com/1007-9327/full/v20/i15/4345.htm
- DOI: https://dx.doi.org/10.3748/wjg.v20.i15.4345


