Copyright
©2014 Baishideng Publishing Group Co.
World J Gastroenterol. Mar 14, 2014; 20(10): 2664-2672
Published online Mar 14, 2014. doi: 10.3748/wjg.v20.i10.2664
Published online Mar 14, 2014. doi: 10.3748/wjg.v20.i10.2664
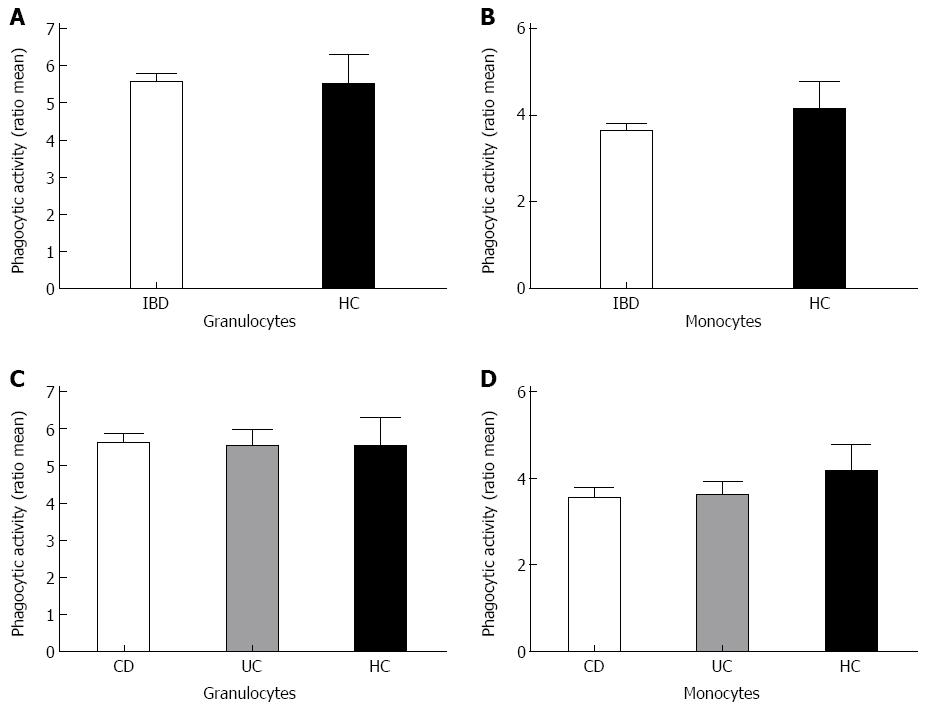
Figure 1 Phagocytic activity of the disease groups compared to healthy controls.
Bars represent ratio of the mean phagocytic activity. Total inflammatory bowel disease patients (IBD) patients (A, B for granulocytes and monocytes respectively) were analyzed as well as for separate Crohn’s disease (CD) and ulcerative colitis (UC) patients compared to healthy controls (C, D). HC: Healthy controls.
-
Citation: Wolfkamp SC, Verseyden C, Vogels EW, Meisner S, Boonstra K, Peters CP, Stokkers PC, te Velde AA.
ATG16L1 andNOD2 polymorphisms enhance phagocytosis in monocytes of Crohn’s disease patients. World J Gastroenterol 2014; 20(10): 2664-2672 - URL: https://www.wjgnet.com/1007-9327/full/v20/i10/2664.htm
- DOI: https://dx.doi.org/10.3748/wjg.v20.i10.2664


