Copyright
©2014 Baishideng Publishing Group Co.
World J Gastroenterol. Jan 7, 2014; 20(1): 163-174
Published online Jan 7, 2014. doi: 10.3748/wjg.v20.i1.163
Published online Jan 7, 2014. doi: 10.3748/wjg.v20.i1.163
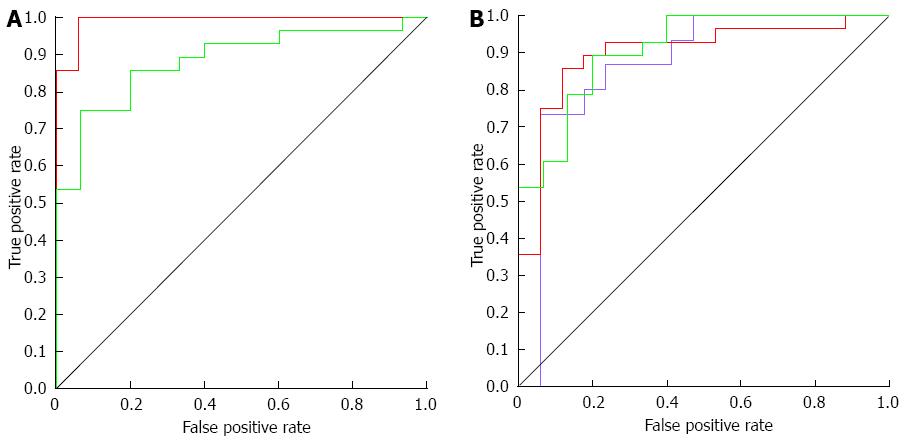
Figure 4 Receiver operating characteristic curves based on partial least-squares-discriminant analysis models for nuclear magnetic resonance spectra.
A: Serum samples; B: Urine samples. Serum: Red - IBD active vs control (AUC = 0.992); Green - IBD active vs IBD remission (AUC = 0.883). Urine: Red - IBD active vs control (AUC = 0.900); Green - IBD active vs IBD remission (AUC = 0.909); Violet - IBD remission vs Control (AUC = 0.871). IBD: Inflammatory bowel diseases; AUC: Area under curves.
- Citation: Dawiskiba T, Deja S, Mulak A, Ząbek A, Jawień E, Pawełka D, Banasik M, Mastalerz-Migas A, Balcerzak W, Kaliszewski K, Skóra J, Barć P, Korta K, Pormańczuk K, Szyber P, Litarski A, Młynarz P. Serum and urine metabolomic fingerprinting in diagnostics of inflammatory bowel diseases. World J Gastroenterol 2014; 20(1): 163-174
- URL: https://www.wjgnet.com/1007-9327/full/v20/i1/163.htm
- DOI: https://dx.doi.org/10.3748/wjg.v20.i1.163


