Copyright
©2013 Baishideng Publishing Group Co.
World J Gastroenterol. Dec 14, 2013; 19(46): 8671-8677
Published online Dec 14, 2013. doi: 10.3748/wjg.v19.i46.8671
Published online Dec 14, 2013. doi: 10.3748/wjg.v19.i46.8671
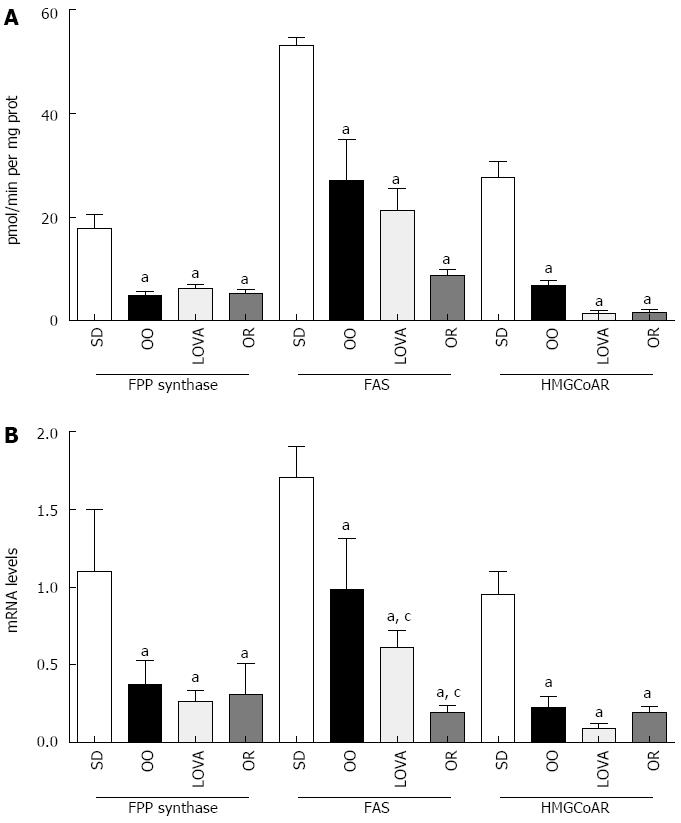
Figure 1 Farnesyl pyrophosphate synthase, fatty acid synthase and 3-hydroxyl-3-methyl-glutaryl CoA reductase activity, mRNA levels in the four groups of treatment.
A: Activity levels in the four groups of treatment. aP < 0.05 vs SD group (one-way analysis of variance and Tukey’s Multiple Comparison Test). Data are expressed as mean ± SE; B: mRNA levels in the four groups of treatment. aP < 0.05 vs SD group (one-way analysis of variance and Tukey’s Multiple Comparison Test); cP < 0.05 vs OO group (Tukey’s Multiple Comparison Test). Data expressed as n molecules mRNA target gene/n molecules mRNA β-actin. SD: Standard diet; OO: Olive oil; LOVA: Olive oil plus lovastatin; OR: Olive oil plus orlistat; FPP: Farnesyl pyrophosphate; FAS: Fatty acid synthase; HMGCoAR: 3-hydroxyl-3-methyl-glutaryl CoA reductase.
- Citation: Notarnicola M, Caruso MG, Tafaro A, Tutino V, Bianco G, Minoia M, Francavilla A. Dietary-suppression of hepatic lipogenic enzyme expression in intact male transgenic mice. World J Gastroenterol 2013; 19(46): 8671-8677
- URL: https://www.wjgnet.com/1007-9327/full/v19/i46/8671.htm
- DOI: https://dx.doi.org/10.3748/wjg.v19.i46.8671


