Copyright
©2013 Baishideng Publishing Group Co.
World J Gastroenterol. Nov 7, 2013; 19(41): 7146-7153
Published online Nov 7, 2013. doi: 10.3748/wjg.v19.i41.7146
Published online Nov 7, 2013. doi: 10.3748/wjg.v19.i41.7146
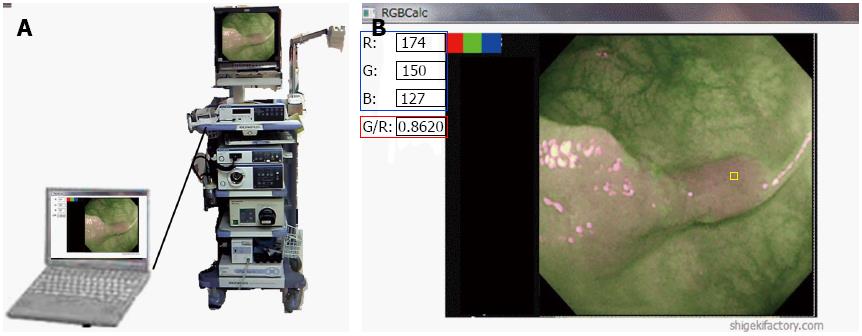
Figure 3 A method for real-time color intensity analysis calculated software.
A: A personal computer with software that enables real-time color tone analysis was connected to the endoscopy system. B: The user interface of the personal computer for color tone analysis. The region of interest was chosen using the cursor (yellow square). The color tone intensity (blue square) and the green/red ratio (red square), which is obtained by dividing the green color tone intensity by the red color tone intensity, were calculated automatically.
- Citation: Inomata H, Tamai N, Aihara H, Sumiyama K, Saito S, Kato T, Tajiri H. Efficacy of a novel auto-fluorescence imaging system with computer-assisted color analysis for assessment of colorectal lesions. World J Gastroenterol 2013; 19(41): 7146-7153
- URL: https://www.wjgnet.com/1007-9327/full/v19/i41/7146.htm
- DOI: https://dx.doi.org/10.3748/wjg.v19.i41.7146


