Copyright
©2013 Baishideng Publishing Group Co.
World J Gastroenterol. Oct 28, 2013; 19(40): 6911-6918
Published online Oct 28, 2013. doi: 10.3748/wjg.v19.i40.6911
Published online Oct 28, 2013. doi: 10.3748/wjg.v19.i40.6911
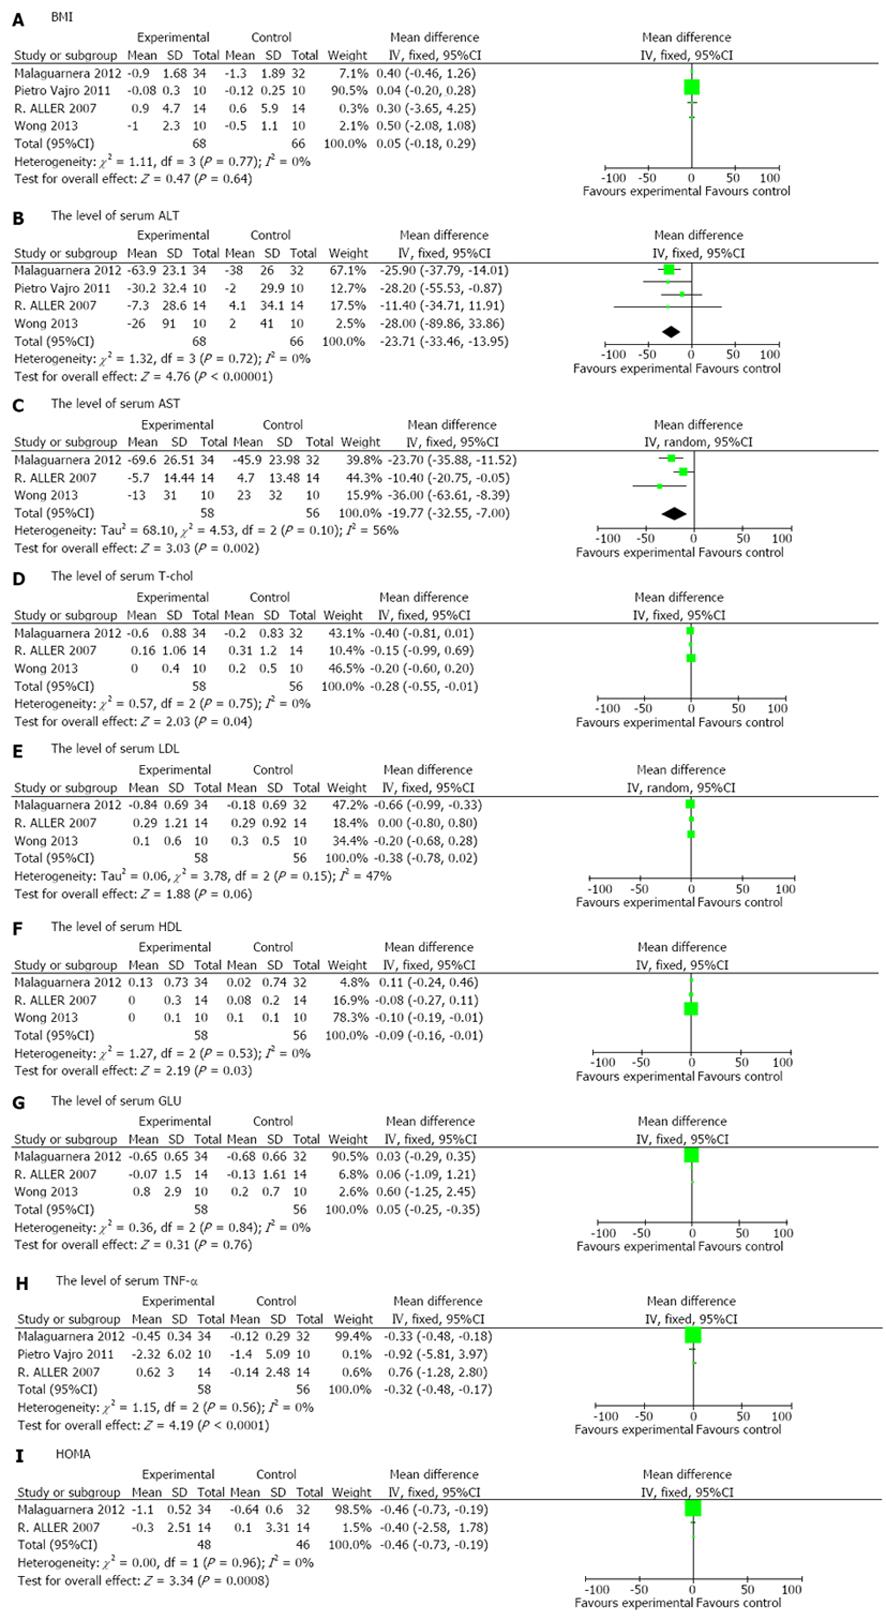
Figure 2 Forest plot of the effects of probiotics in patients with nonalcoholic fatty liver disease.
A: BMI; B: The level of serum ALT; C: The level of serum AST; D:The level of serum T-chol; E: The level of serum LDL; F: The level of serum HDL; G: The level of serum GLU; H: The level of serum TNF-α; I: HOMA. BMI: Body mass index; ALT: Alanine aminotransferase; AST: Aspartate transaminase; T-chol: total-cholesterol; LDL: Low density lipoprotein; HDL: High density lipoprotein; GLU: Glucose; HOMA: Homeostasis model assessment.
- Citation: Ma YY, Li L, Yu CH, Shen Z, Chen LH, Li YM. Effects of probiotics on nonalcoholic fatty liver disease: A meta-analysis. World J Gastroenterol 2013; 19(40): 6911-6918
- URL: https://www.wjgnet.com/1007-9327/full/v19/i40/6911.htm
- DOI: https://dx.doi.org/10.3748/wjg.v19.i40.6911


