Copyright
©2013 Baishideng Publishing Group Co.
World J Gastroenterol. Jan 28, 2013; 19(4): 482-491
Published online Jan 28, 2013. doi: 10.3748/wjg.v19.i4.482
Published online Jan 28, 2013. doi: 10.3748/wjg.v19.i4.482
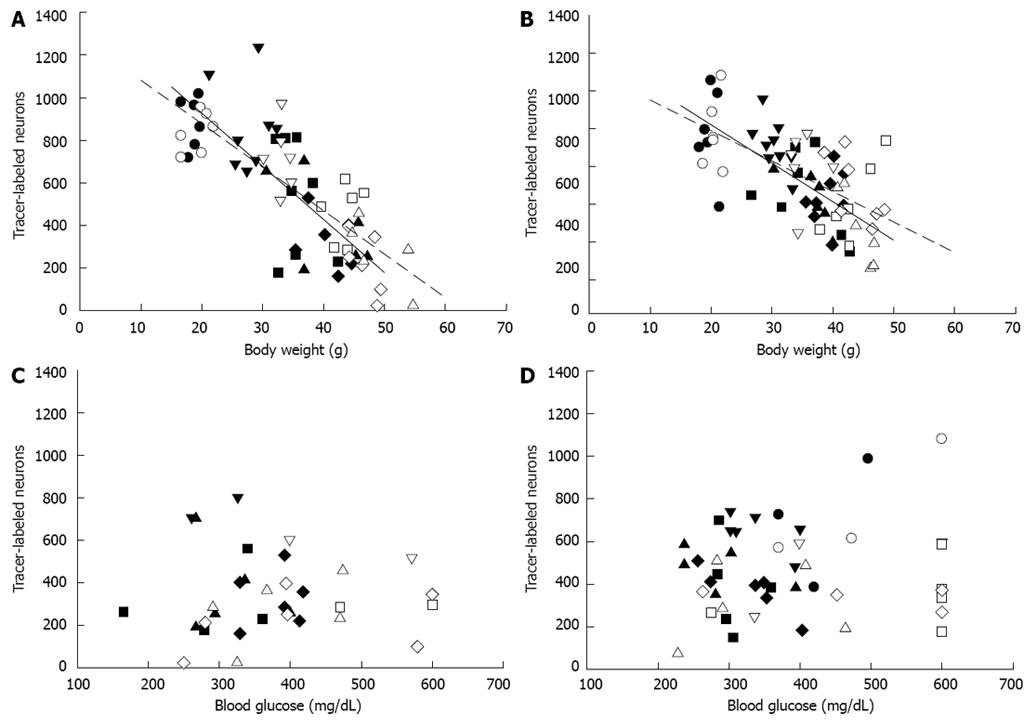
Figure 4 Correlation of body weight or stress-elevated blood glucose with number of tracer-labeled enteric neurons.
A: Body weight was correlated with number of neurons labeled by fundus injection (KK mice, r2 = 0.4362; KKAy mice, r2 = 0.3868); B: Body weight was correlated with number of neurons labeled by antrum injection (KK mice, r2 = 0.5565; KKAy mice, r2 = 0.7087); C: Stress-elevated blood glucose was not correlated with number of neurons labeled by fundus injection (KK mice, r2 = 0.0093; KKAy mice, r2 = 0.108); D: Stress-elevated blood glucose was not correlated with number of neurons labeled by antrum injection (KK mice, r2 = 0.0301; KKAy mice, r2 = 0.0947). Legend: Black symbols and solid line, KK mice; white symbols and dashed line, KKAy mice; circle, 4 wk; inverted triangle, 8 wk; square, 16 wk; diamond, 24 wk; upright triangle, 32 wk.
- Citation: LePard KJ, Cellini J. Age-dependent slowing of enteric axonal transport in insulin-resistant mice. World J Gastroenterol 2013; 19(4): 482-491
- URL: https://www.wjgnet.com/1007-9327/full/v19/i4/482.htm
- DOI: https://dx.doi.org/10.3748/wjg.v19.i4.482


