Copyright
©2013 Baishideng Publishing Group Co.
World J Gastroenterol. Oct 14, 2013; 19(38): 6416-6426
Published online Oct 14, 2013. doi: 10.3748/wjg.v19.i38.6416
Published online Oct 14, 2013. doi: 10.3748/wjg.v19.i38.6416
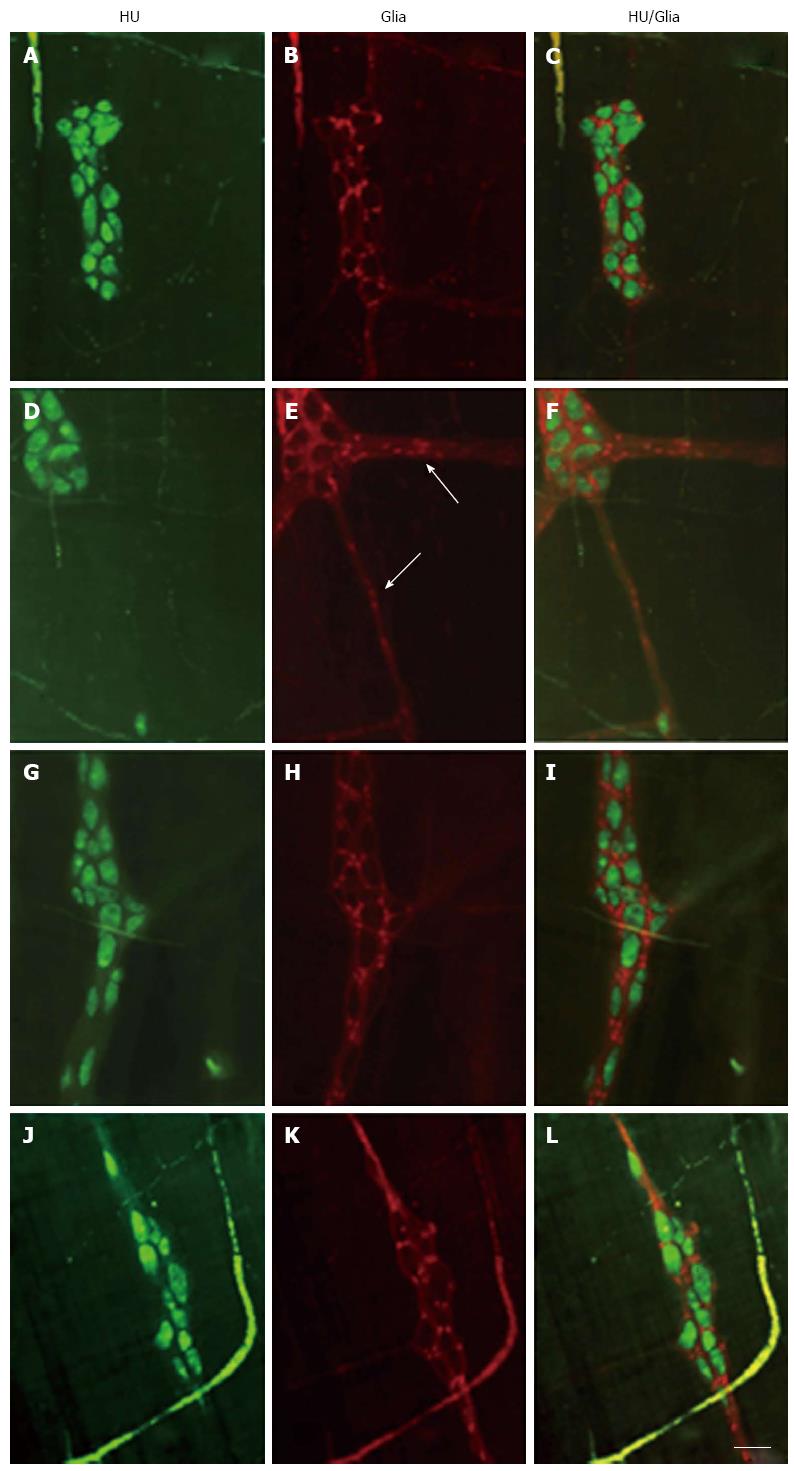
Figure 2 Representative micrographs showing immunoreactivity to HuC/D (green) and S-100 (red) in the myenteric plexus of the rat cecum.
A-C: Control group; D-F: Quercetin supplemented control group; G-I, Diabetic group; J-L: Quercetin supplemented diabetic group. White arrows indicate glial cells present in nerve fibers. Scale bar = 50 μm.
- Citation: Ferreira PEB, Lopes CRP, Alves AMP, Alves &PB, Linden DR, Zanoni JN, Buttow NC. Diabetic neuropathy: An evaluation of the use of quercetin in the cecum of rats. World J Gastroenterol 2013; 19(38): 6416-6426
- URL: https://www.wjgnet.com/1007-9327/full/v19/i38/6416.htm
- DOI: https://dx.doi.org/10.3748/wjg.v19.i38.6416


