Copyright
©2013 Baishideng Publishing Group Co.
World J Gastroenterol. Sep 28, 2013; 19(36): 6118-6121
Published online Sep 28, 2013. doi: 10.3748/wjg.v19.i36.6118
Published online Sep 28, 2013. doi: 10.3748/wjg.v19.i36.6118
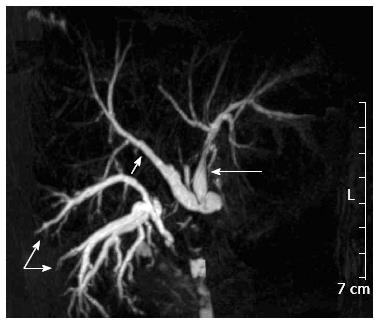
Figure 3 Magnetic resonance cholangiography with the use of T2-weighted sequences and maximum-intensity-projection imaging.
The fluid-containing bile ducts as high signal-intensity structures; the right posterior hepatic ducts of segments 6 and 7 are shown (double arrow) with no connection to the right anterior duct (single short arrow) and the left hepatic duct (single long arrow); the abdominal drain placed in the subhepatic area and draining the bile externally is also visible in between the right anterior and posterior hepatic ducts.
- Citation: Wojcicki M, Patkowski W, Chmurowicz T, Bialek A, Wiechowska-Kozlowska A, Stankiewicz R, Milkiewicz P, Krawczyk M. Isolated right posterior bile duct injury following cholecystectomy: Report of two cases. World J Gastroenterol 2013; 19(36): 6118-6121
- URL: https://www.wjgnet.com/1007-9327/full/v19/i36/6118.htm
- DOI: https://dx.doi.org/10.3748/wjg.v19.i36.6118


