Copyright
©2013 Baishideng Publishing Group Co.
World J Gastroenterol. Sep 28, 2013; 19(36): 6044-6054
Published online Sep 28, 2013. doi: 10.3748/wjg.v19.i36.6044
Published online Sep 28, 2013. doi: 10.3748/wjg.v19.i36.6044
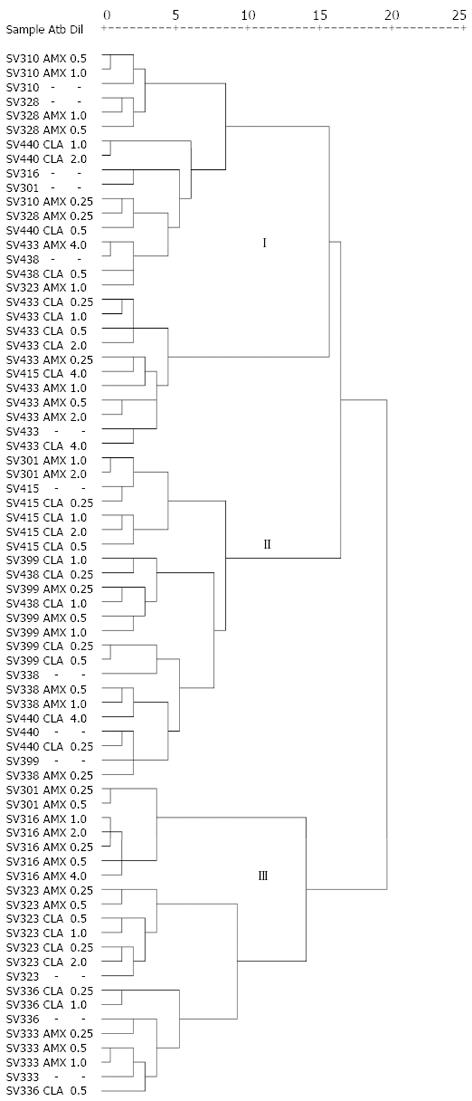
Figure 2 Dendrogram of the profile of random amplified polymorphic DNAs generated with primer 1254 in Helicobacter pylori isolates resistant in baseline and resistant isolates growing at each of the serial dilutions of amoxicillin and clarithromycin.
Three separate clusters (I, II and III) are indicated. In none of the clusters was segregation of sensitive and resistant isolates significant (P = 0.704). Cluster analyses were designed by following Ward’s hierarchical clustering method and estimation of distances between each pair of Helicobacter pylori (H. pylori) isolates were calculated with the squared Euclidean distance. Distances between isolates are given in a 25-point standardized scale that reflects with sufficient precision the existing proportionality between the original distances. The fusions produced near the origin of the scale (left) indicate that the cluster formed is quite homogeneous. Conversely, fusions produced on the final zone of the scale (right) indicate the cluster formed is quite heterogeneous. Atb: Antibiotic, Dil: Dilution.
-
Citation: Bustamante-Rengifo JA, Matta AJ, Pazos A, Bravo LE.
In vitro effect of amoxicillin and clarithromycin on the 3’ region ofcagA gene inHelicobacter pylori isolates. World J Gastroenterol 2013; 19(36): 6044-6054 - URL: https://www.wjgnet.com/1007-9327/full/v19/i36/6044.htm
- DOI: https://dx.doi.org/10.3748/wjg.v19.i36.6044


