Copyright
©2013 Baishideng Publishing Group Co.
World J Gastroenterol. Sep 28, 2013; 19(36): 6026-6034
Published online Sep 28, 2013. doi: 10.3748/wjg.v19.i36.6026
Published online Sep 28, 2013. doi: 10.3748/wjg.v19.i36.6026
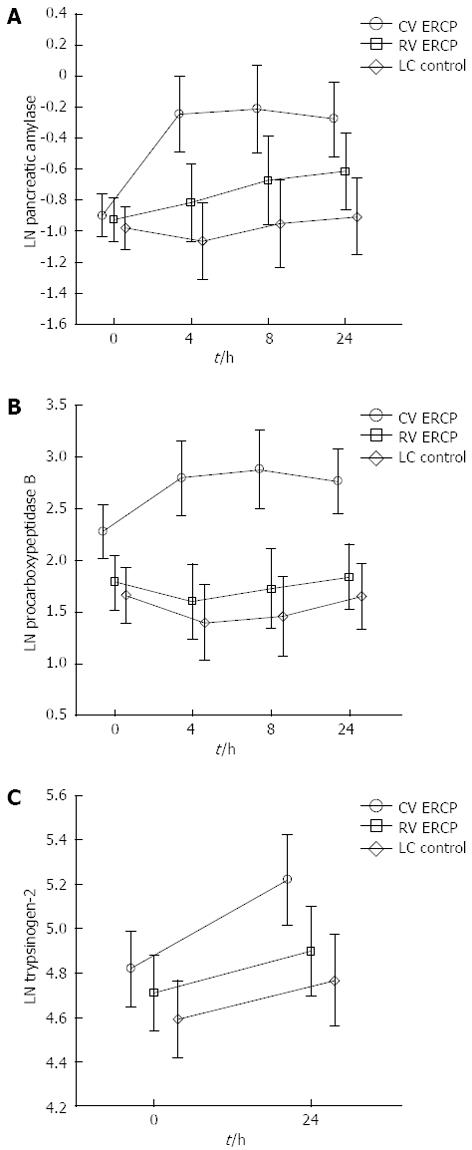
Figure 2 Approximative analysis and figure based on serum values at all times (0, 4, 8 and 24 h) using a mixed linear model.
A: Pancreatic amylase before (0) and at 4, 8 and 24 h after the procedure; B: Procarboxypeptidase B before (0) and at 4, 8 and 24 h after the procedure; C: Trypsinogen-2 before (0) and at 24 h after the procedure. y-axis values are logarithmically transformed. Vertical bars denote 95% confidence intervals. Circles: Conventional endoscopic retrograde cholangiopancreatography (ERCP); Squares: Rendezvous ERCP; Diamonds: Laparoscopic cholecystectomy control.
- Citation: Swahn F, Regnér S, Enochsson L, Lundell L, Permert J, Nilsson M, Thorlacius H, Arnelo U. Endoscopic retrograde cholangiopancreatography with rendezvous cannulation reduces pancreatic injury. World J Gastroenterol 2013; 19(36): 6026-6034
- URL: https://www.wjgnet.com/1007-9327/full/v19/i36/6026.htm
- DOI: https://dx.doi.org/10.3748/wjg.v19.i36.6026


