Copyright
©2013 Baishideng Publishing Group Co.
World J Gastroenterol. Sep 7, 2013; 19(33): 5586-5589
Published online Sep 7, 2013. doi: 10.3748/wjg.v19.i33.5586
Published online Sep 7, 2013. doi: 10.3748/wjg.v19.i33.5586
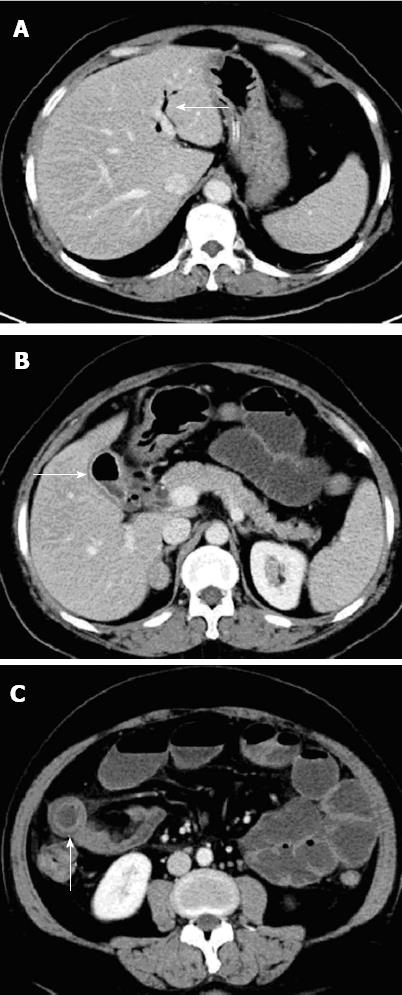
Figure 2 Severe air-fluid level.
A: Axial view of the upper abdomen demonstrates air in an intrahepatic bile duct (arrow); B: Axial view of the upper abdomen demonstrates an air in the gallbladder (arrow); C: Computed tomography demonstrating gallstones of approximately 5 cm in diameter (arrow) within the small bowel.
- Citation: Dai XZ, Li GQ, Zhang F, Wang XH, Zhang CY. Gallstone ileus: Case report and literature review. World J Gastroenterol 2013; 19(33): 5586-5589
- URL: https://www.wjgnet.com/1007-9327/full/v19/i33/5586.htm
- DOI: https://dx.doi.org/10.3748/wjg.v19.i33.5586


