Copyright
©2013 Baishideng Publishing Group Co.
World J Gastroenterol. Aug 14, 2013; 19(30): 4887-4896
Published online Aug 14, 2013. doi: 10.3748/wjg.v19.i30.4887
Published online Aug 14, 2013. doi: 10.3748/wjg.v19.i30.4887
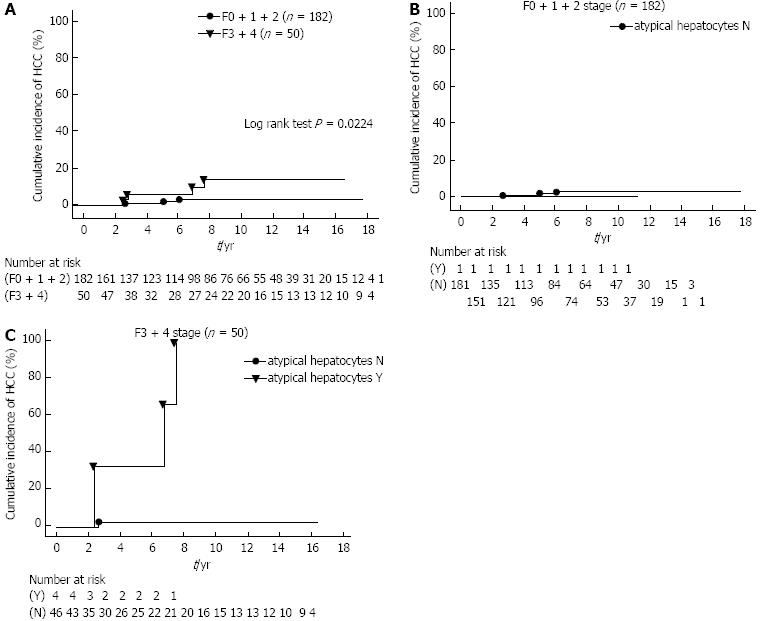
Figure 2 Comparison of the cumulative incidence of hepatocellular carcinoma.
A: Between patients with sustained virological response in the F0 + 1 + 2 and F3 + 4 groups. The cumulative incidence of hepatocellular carcinoma (HCC) was compared between patients with sustained virological response in the F0 + 1 + 2 and F3 + 4 groups by the Kaplan-Meier method. HCC developed in seven of 232 (3.0%) patients, which included three of 182 (1.6%) patients in the F0 + 1 + 2 group, and four of 50 (8.0%) patients in the F3 + 4 group. The cumulative incidence of hepatocellular carcinoma in the former group was found to be significantly lower than in the F3 + 4 group (log rank test P = 0.0224). Values below the graphs show the numbers at risk; B and C: Between patients with sustained virological response in the atypical hepatocytes (N) and (Y) groups, according to the F0 + 1 + 2 and F3 + 4 groups. HCC developed in seven of 232 (3.0%) patients, of which three belonged to the F0 + 1 + 2 group and four to the F3 + 4 group. To correct for the atypical hepatocytes, the 232 patients were divided into two groups as follows: those with an absence (score 0) of atypical hepatocytes (N group, n = 227) and those with presence (score 1) of atypical hepatocytes (Y group, n = 5). The Y group included all cases with scores 1-4, but actually there were only cases with score 1. The cumulative incidence of HCC was compared in the F0 + 1 + 2 and F3 + 4 patients according to the atypical hepatocyte status by the Kaplan-Meier method. For the F3 + 4 patients, we found that there was a significantly lower cumulative incidence of HCC in the N group as compared to the Y group (log rank test, P = 0.0001). Values below the graphs show the numbers at risk.
- Citation: Matsumura H, Nirei K, Nakamura H, Higuchi T, Arakawa Y, Ogawa M, Tanaka N, Moriyama M. Histopathology of type C liver disease for determining hepatocellular carcinoma risk factors. World J Gastroenterol 2013; 19(30): 4887-4896
- URL: https://www.wjgnet.com/1007-9327/full/v19/i30/4887.htm
- DOI: https://dx.doi.org/10.3748/wjg.v19.i30.4887


