Copyright
©2013 Baishideng Publishing Group Co.
World J Gastroenterol. Jul 28, 2013; 19(28): 4559-4567
Published online Jul 28, 2013. doi: 10.3748/wjg.v19.i28.4559
Published online Jul 28, 2013. doi: 10.3748/wjg.v19.i28.4559
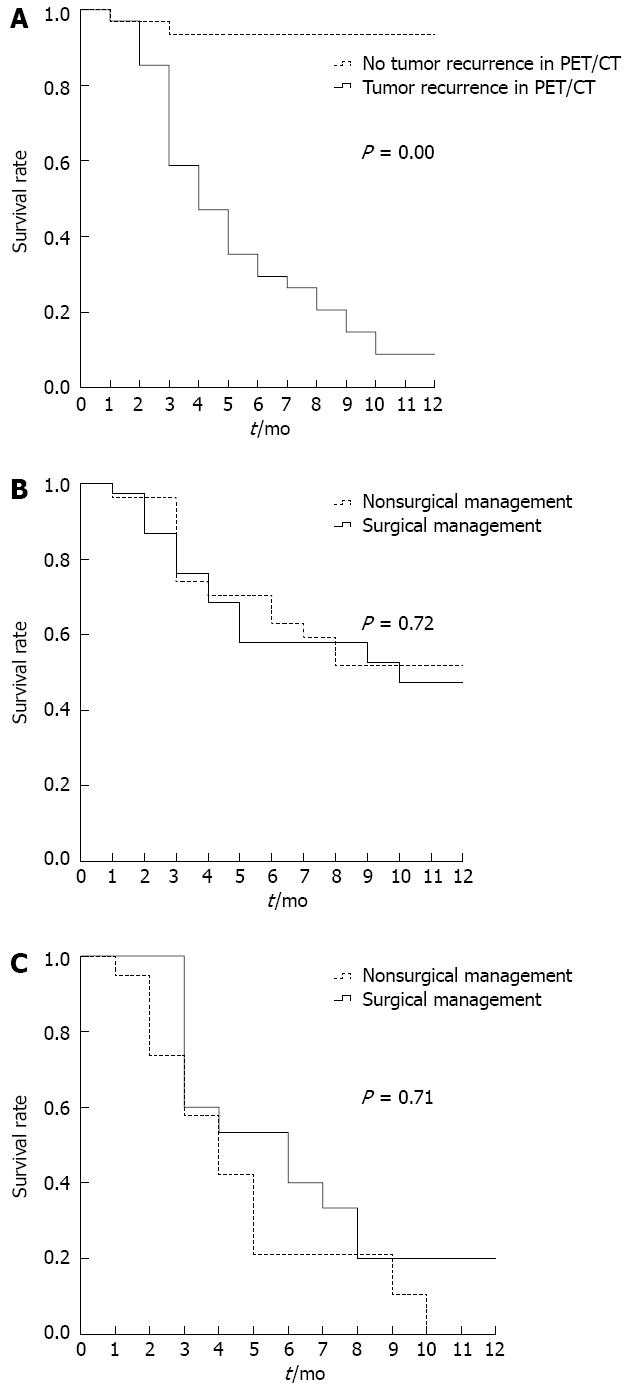
Figure 3 1-year survival curves.
A: With respect to no tumor recurrence and tumor recurrence group in positron emission tomography/computed tomography. There was significant difference between two subgroups (P = 0.00). The 1-year survival rate in positron emission tomography/computed tomography (PET/CT) tumor recurrence group is 8.8%, while 93.5% in no tumor recurrence group; B: With respect to exploratory laparotomy and nonoperative treatment group. There was no difference in 1-year survival based on type of surgical vs nonsurgical management (P = 0.72); C: With respect to tumor recurrence group in positron emission tomography/computed tomography. The 1-year survival rates for patients in each subgroup were, respectively, 0.0% for tumor nonoperative treatment, and 20% for exploratory laparotomy group. There is also no significant difference between two subgroups (P = 0.71).
- Citation: Wu WG, Dong P, Wu XS, Li ML, Ding QC, Zhang L, Yang JH, Weng H, Ding Q, Tan ZJ, Lu JH, Gu J, Liu YB. Surgical management of patients with bowel obstructions secondary to gastric cancer. World J Gastroenterol 2013; 19(28): 4559-4567
- URL: https://www.wjgnet.com/1007-9327/full/v19/i28/4559.htm
- DOI: https://dx.doi.org/10.3748/wjg.v19.i28.4559


